Supplementary Figure 6
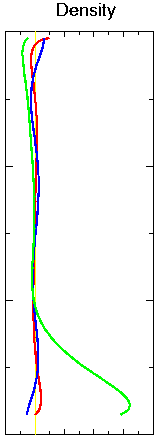
Supplementary Figure 6: Backus-Gilbert resolution kernels
Backus-Gilbert tests indicate where structure in the inverted model
has its origin in the real Earth.
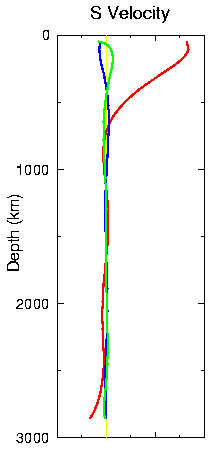
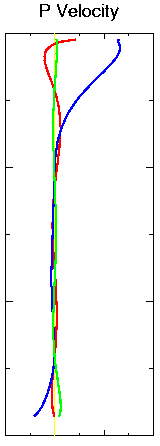
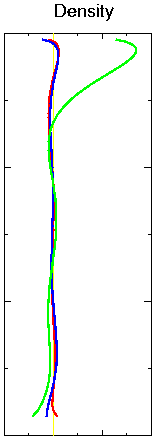
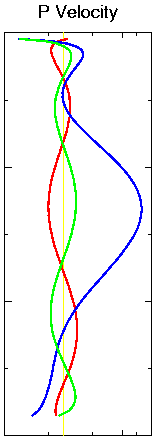
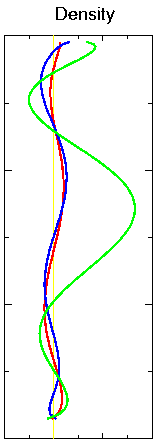
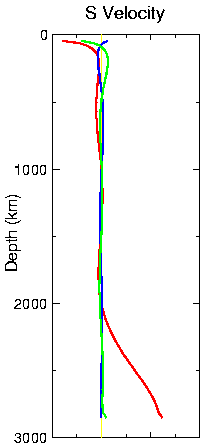
Supplementary Figure 6A
Backus-Gilbert resolution kernels for structure at 200-km
depth with l=4 and m=3 for each of the three volumetric models. The
red curve represents the S velocity, the blue curve represents
the P velocity, and the green curve represents density.
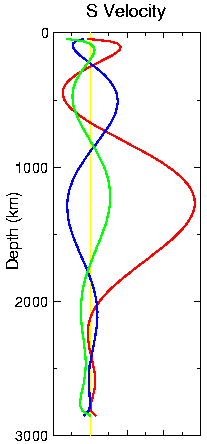
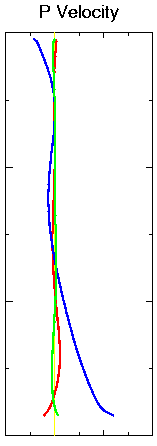
Supplementary Figure 6B
Same as in (A) but with structure at 1300-km depth
with l=6 and m=5. The high angular degree (l=6), which is damped
most strongly, produces broad peaks with large contributions from other
volumetric structures.
Supplementary Figure 6C
Same as in (A) but with structure at 2800-km depth
with l=2 and m=1.
Miaki Ishii, Department of Earth and Planetary Sciences, Harvard University, copyright ©1999, all rights reserved
Last modified: September 7, 1999
