Supplementary Figure 5

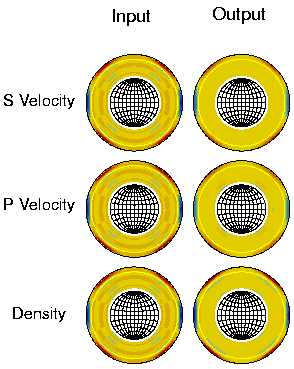
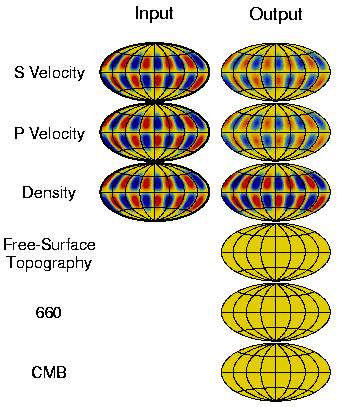
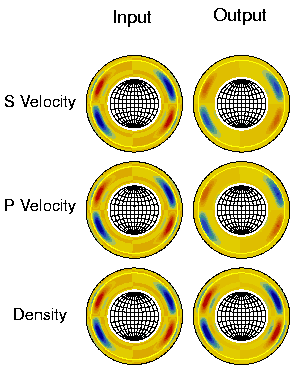
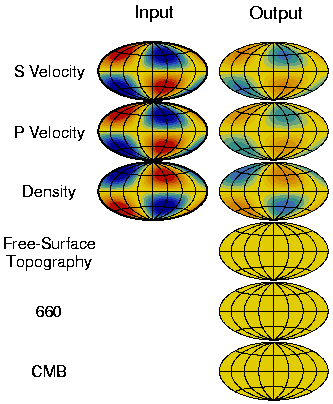
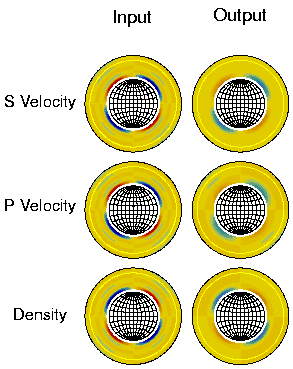
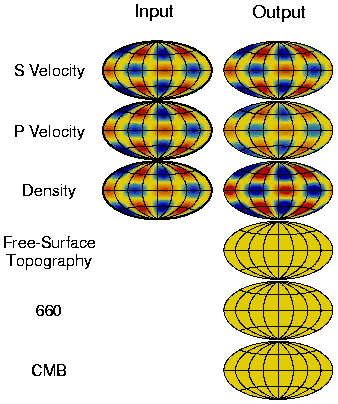
Supplementary Figure 5: Resolution tests with input peak at a depth

Supplementary Figure 5A

Radial input with a peak at 200-km depth and lateral input at spherical harmonic degree l=4 and order m=2.
Map views of the input and output models (plotted at 200-km depth).
Cross sections of the three volumetric models.

Supplementary Figure 5B

Radial input with a peak at 1300-km depth and lateral input at spherical harmonic degree l=6 and order m=5.
Map views of the input and output models (plotted at 1300-km depth).
Cross sections of the three volumetric models.

Supplementary Figure 5C

Radial input with a peak at 2700-km depth and lateral input at spherical harmonic degree l=2 and order m=1.
Map views of the input and output models (plotted at 2700-km depth).
Cross sections of the three volumetric models.


Supplementary Figure 4

Supplementary Figure 6

Index of Figures


Miaki Ishii, Department of Earth and Planetary Sciences, Harvard University, copyright ©1999, all rights reserved
Last modified: September 7, 1999