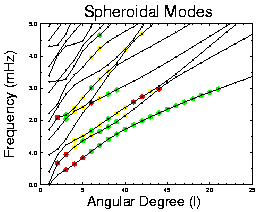
Fundamental spheroidal modes, which are sensitive to shear velocity structure in the mid and upper mantle, consistently show large improvements.
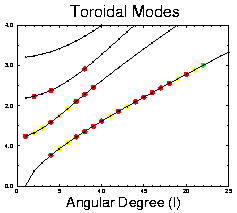
Note that the fit to these modes does not improve very much compared to the spheroidal modes.
|
Fundamental spheroidal modes, which are sensitive to shear velocity structure in the mid and upper mantle, consistently show large improvements. |
Note that the fit to these modes does not improve very much compared to the spheroidal modes. |
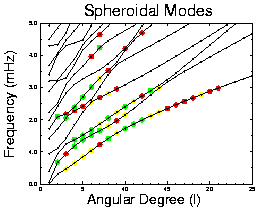 Compared to (A), modes with low angular degree improve in fit when lateral variations in P velocity are added to the inversion. These modes, in particular on the fifth overtone branch, are generally more sensitive to P velocity structure. |
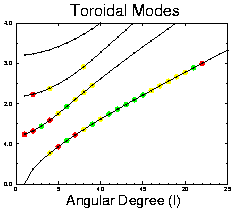 The fundamental toroidal modes show large improvements in fit when independent lateral variations in P velocity are introduced. In model S6, the S velocity model is forced to accommodate P velocity variations as well as S heterogeneity in order to fit the spheroidal modes (many of which have strong sensitivity to P heterogeneity). On the other hand, model SP6 allows for independent variations in S and P velocity such that P sensitive modes no longer alias P structure into S structure. Hence the S model is available to fit the toroidal modes. |
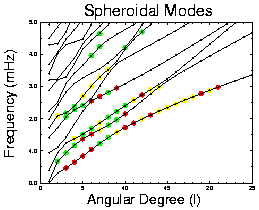 The low degree, higher frequency spheroidal modes are most affected; these are the modes with significant sensitivity to density. |
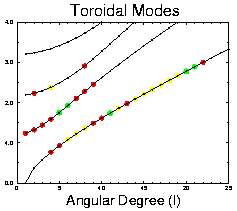 Density heterogeneity does not affect the fit to toroidal modes significantly, which is to be expected. |
Supplementary Figure 8 |
Supplementary Figure 10 |