|
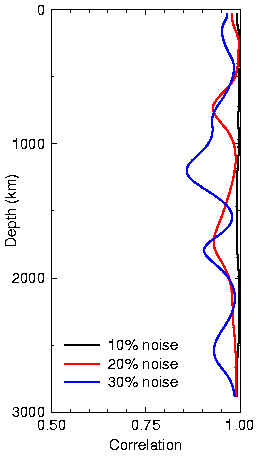
Comparison between the density model of SPRD6 and density obtained from
data to which 10% (black curve), 20% (red curve), and 30% (blue
curve) random noise was added. Note that the correlation ranges from
0.5 to 1.0 on the x-axis instead of from -1.0 to 1.0. We compare only
the density models because they are most affected by the addition of
random noise to the data since density heterogeneity is weaker than
S or P velocity heterogeneity. This figure shows that
the effect of data quality on the modeling is small.
|

