Preliminary Rupture Modelling of the March 11, 2011 Tohoku-Chiho Taiheiyo-Oki Earthquake using the USArray Transportable Array
Point of contact: Eric Kiser
We apply the back-projection technique to distance constrained (< 90 degrees) USArray Transportable Array data to image the rupture properties of the March 11, 2011 Mw 8.9 Tohoku-Chiho Taiheiyo-Oki earthquake. High energy release is observed downdip of the epicentre, and appears to involve three segments along the plate interface.
The rupture region of the magnitude 7.2 Sanriku-Oki earthquake on March 9, 2011 does not overlap with the rupture area of the Mw 8.9 March 11 event, suggesting that the Sanriku-Oki earthquake is not a foreshock (in the sense that it does not occur on the rupture plane of the mainshock) but rather an independent event that may have triggered the Mw 8.9 earthquake.
Similarly, the rupture area of a magnitude 6.8 Ibaraki-Oki earthquake that happened about half an hour after the Mw 8.9 event does not overlap with the rupture area of the Tohoku-Chiho Taiheiyo-Oki earthquake, suggesting that this is not an aftershock. It is possible that this adjacent semgement has been triggered by slip of the Mw 8.9 event.
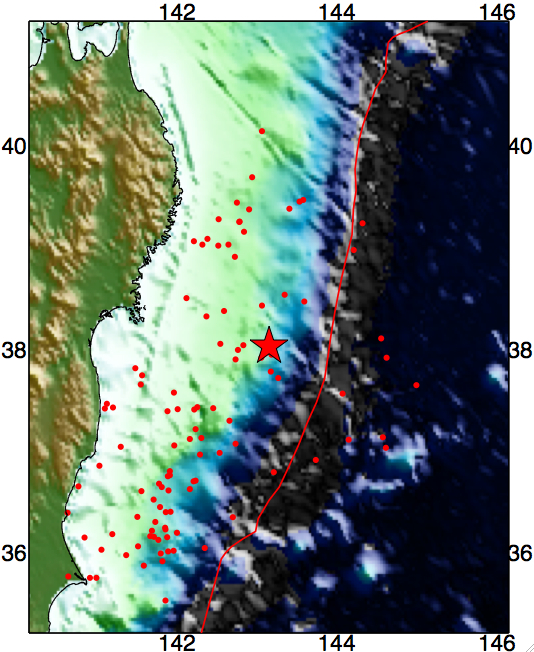
Propagation of the rupture front as imaged by the USArray Transportable arrays (right). The plotted quantity is the squared amplitude of the back-projected stacks, i.e., proportional to released energy at high frequencies. Warmer colours indicate higher relative energy release, the red line is the trench location, and the white star is the epicenter. Time with respect to the hypocentral time is shown at the top left corner.
 |
 |
| If you are interested in obtaining a higher-resolution GIF (~18MB) or QuickTime (~43MB) animation, contact Eric Kiser.
| |
Energy Distribution
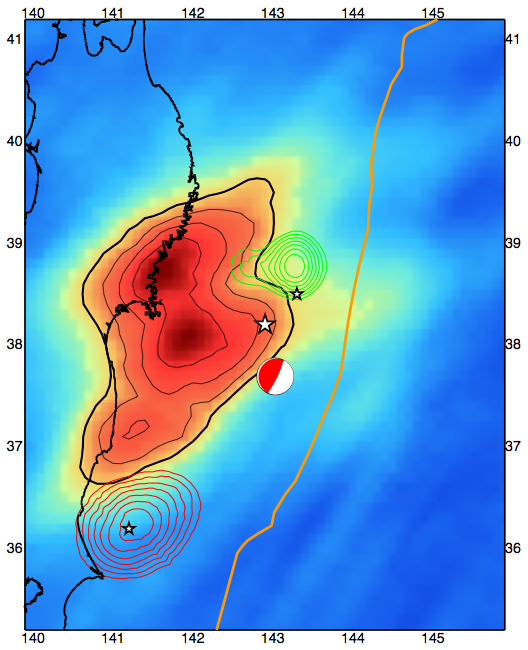 |
Energy distribution for the entire March 11, 2011 Tohoku-Chiho Taiheiyo-Oki earthquake. The large white star is the epicenter of the mainshock, the focal mechanism comes from the Global CMT catalogue. The background colors and the black contours are the back-projection results from the March 11th mainshock. The green and red contours are the back-projection results from a Mw 7.2 event that occurred on March 9th and a Mw 6.8 event that occurred about 30 minutes after the mainshock, respectively. The small white stars are the epicenters for these events. Note the lack of overlap between these smaller events and the mainshock. The thick black line is the coastline and the the orange line is the trench location. Based upon the area of the back-projection results, we estimate a magnitude of 8.7, a rupture length of 390 km, and a rupture width of 240 km. |
Time Dependence
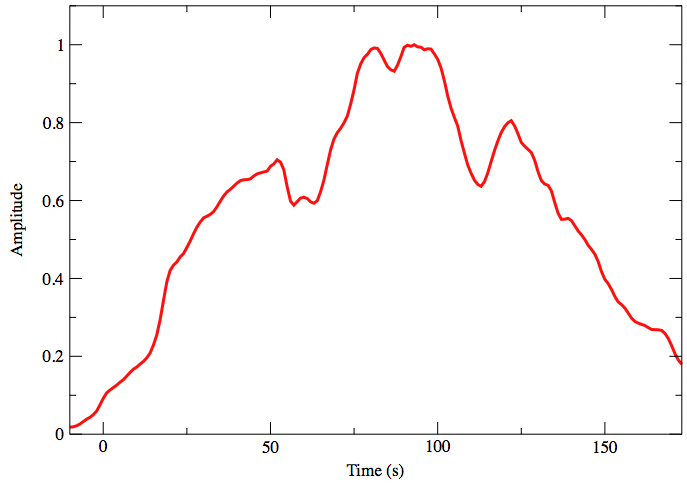 |
Normalized peak amplitude as a function of time, showing four significant episodes of high-frequency energy release at about 50, 80, 95, and 120 seconds. The duration of the event is inferred to be about 150 seconds. |
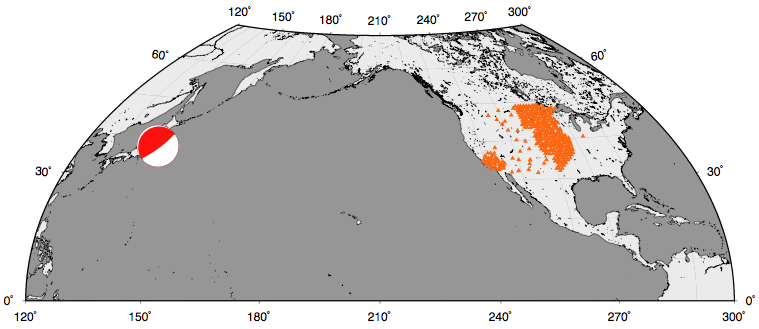 |
Relative Locations of the Earthquake and Array Stations Focal mechanism of the 2011 Tohoku-Chiho Taiheiyo-Oki earthquake (red beach ball) with respect to the USArray Transportable Array (390 stations, orange triangles). |
December 26, 2004 Mw 9.3 Sumatra-Andaman Earthquake
February 27, 2010 Mw 8.8 Maule, Chile Earthquake
Back to March 11, 2011 Mw 9.0 Tohoku-Chiho Taiheiyo-Oki Earthquake Main Page
The USArray Transportable Array data were obtained from the Incorporated Research Institutions for Seismology Data Management Center.