Rupture Modelling of the March 11, 2011 Tohoku-Chiho Taiheiyo-Oki Earthquake and Sequence of Events using the USArray Transportable Array
Point of contact: Eric Kiser
The sequence of earthquakes starting with the Mw 7.2 Sanriku-Oki earthquake on March 9, 2011, and large earthquakes immediately following the Mw 9.0 Tohoku-Chiho Taiheiyo-Oki event are analyzed, and show that there are events that ruptured in regions not covered by the Mw 9.0 earthquake. In the strict definition of foreshocks and aftershocks (earthquake occurring on the rupture plane of the mainshock before and after the mainshock hypocentral time), these earthquakes are not foreshock and aftershocks, but cascading failure of different segments of the plate interface. Almost all of the triggered earthquakes start at the boundary with previous earthquake, and propagate into regions that have not slipped. This observation suggests that the Mw 9.0 earthquake could have been larger (as large as 9.4) if all the segments failed within a single event.
Based upon this analysis, the "mainshock" can be re-defined as a collection of events that broke different parts of the plate interface. The slip region of this "mainshock" should correspond roughly with the distribution of earthquakes (aftershocks) that come after the event. We can identify the set of earthquakes that would constitute this "mainshock", and they occur within the first 25 minutes of the hypocentral time of the Mw 9.0 earthquake. The "mainshock" broke almost the entire coupled region of the plate interface between 36 degrees N and 40.5 degrees N.
 |
 |
| If you are interested in obtaining a higher-resolution QuickTime animation (~96MB), contact Eric Kiser.
| |
Propagation of the rupture front as imaged by the USArray Transportable arrays (right). The plotted quantity is the squared amplitude of the back-projected stacks, i.e., proportional to released energy at high frequencies. Warmer colours indicate higher relative energy release, the red line is the trench location, and the red star is the epicenter. Time with respect to the hypocentral time is shown at the top left right.
The animation starts with an outline of the rupture area of the March 9, 2011 Mw 7.2 earthquake close to the epicentre of the Mw 9.0 earhtquake (yellow contour).
As energy release finishes for each earthquake, a contour depicting the rupture region of the earthquake is shown. The red contours are for the three segments that ruptured during the Mw 9.0 earthquake, and white contours are for subsequent events.
The animation finishes with outlines of additional large earthquake that occurred subsequently: 06:15:45 (Mw 7.3), 06:25:51 (Mw 7.4 outer rise), 07:14:56 (Mw 6.7), 08:12:04 (Mw 6.6), 08:19:24 (Mw 6.8), 11:36:39 (Mw 6.7), and March 12, 01:47:16 (Mw 6.8). Note that the area that is active does not expand significantly with these later events, suggesting that even though there are additional triggering, the main slip occurred within the first 25 minutes. The final few frames of the animation includes aftershock locations in the first 3 days following the Mw 9.0 earthquake as well as one day following the March 09 Mw 7.2 event (yellow dots).
More information about the events imaged in the animation is available here.
Rupture Extent and Time Dependence of the Super Mainshock
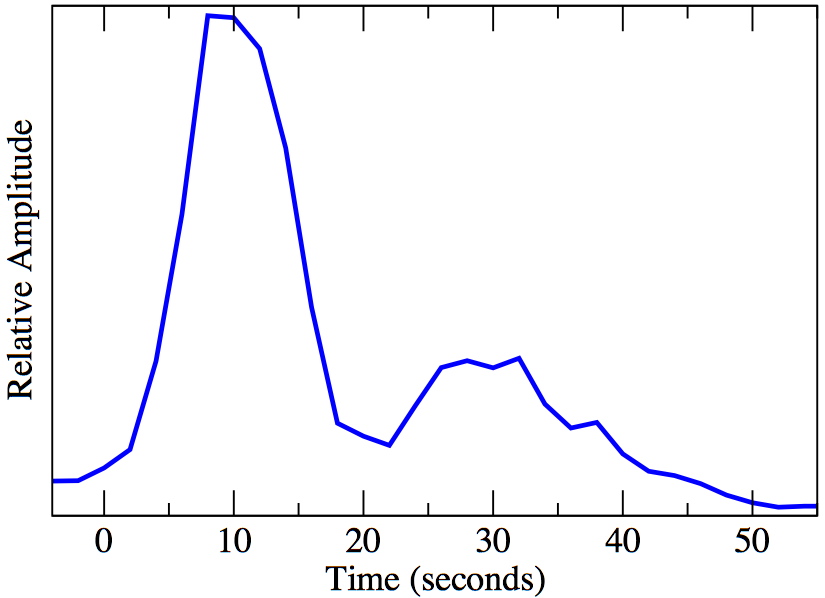
| Relative Energy Release | Source-Time Function |
 |
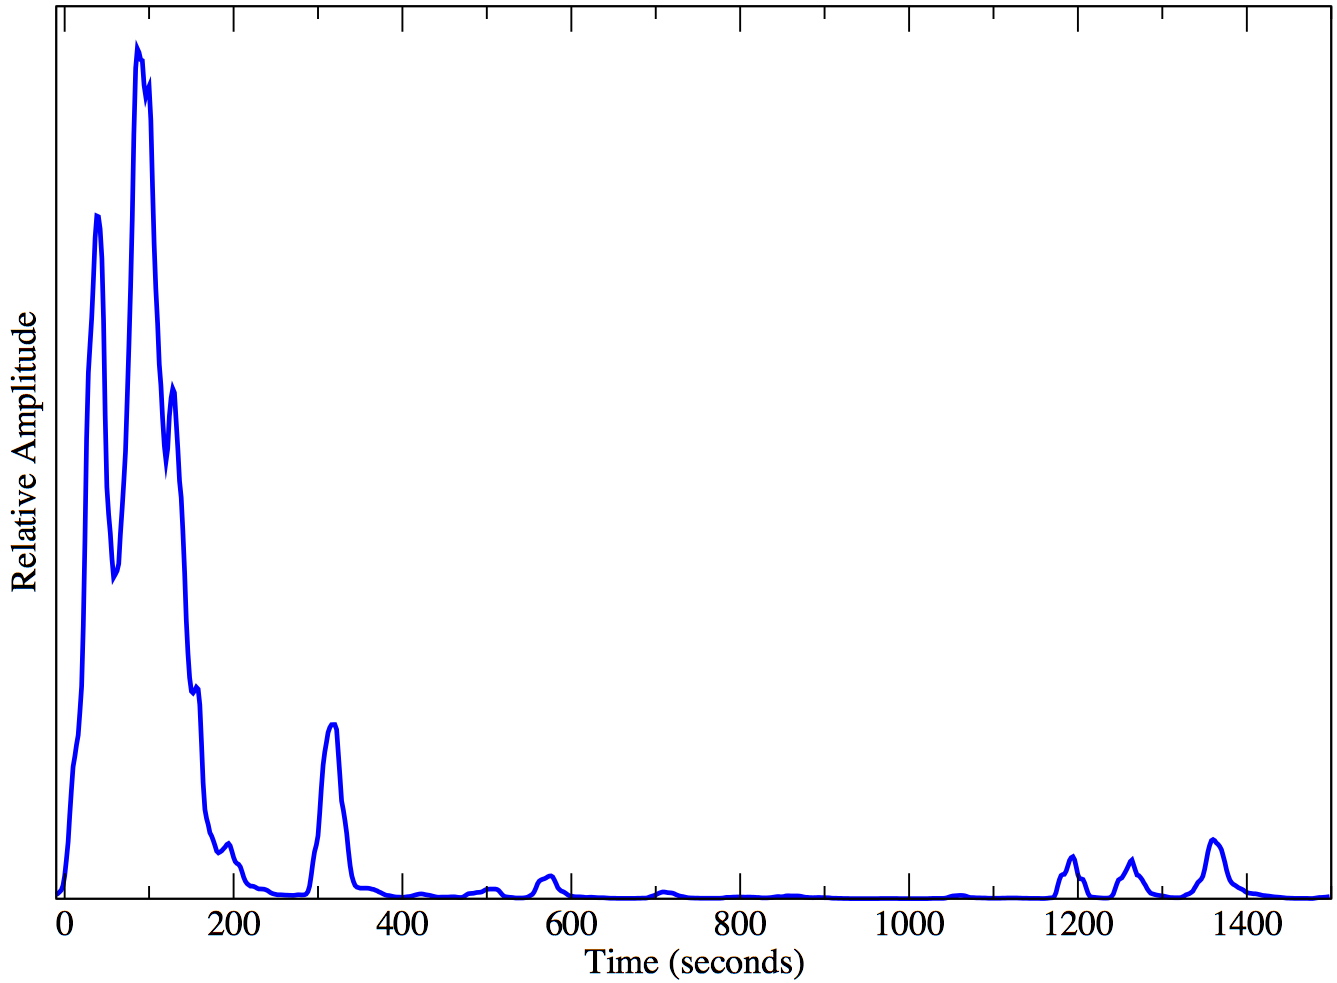 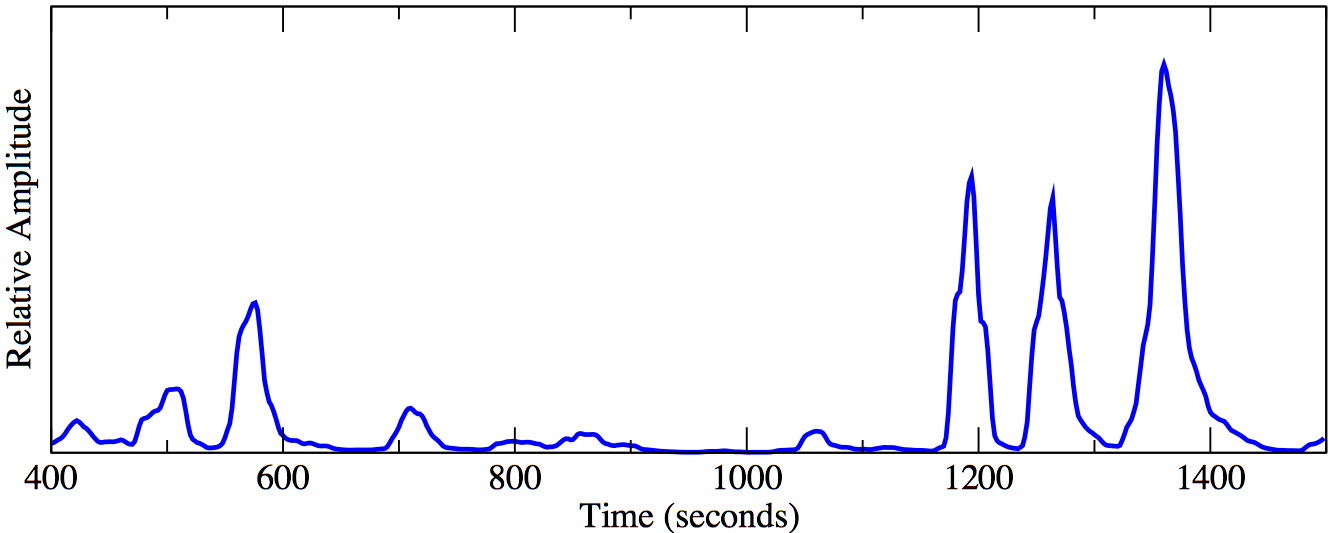 |
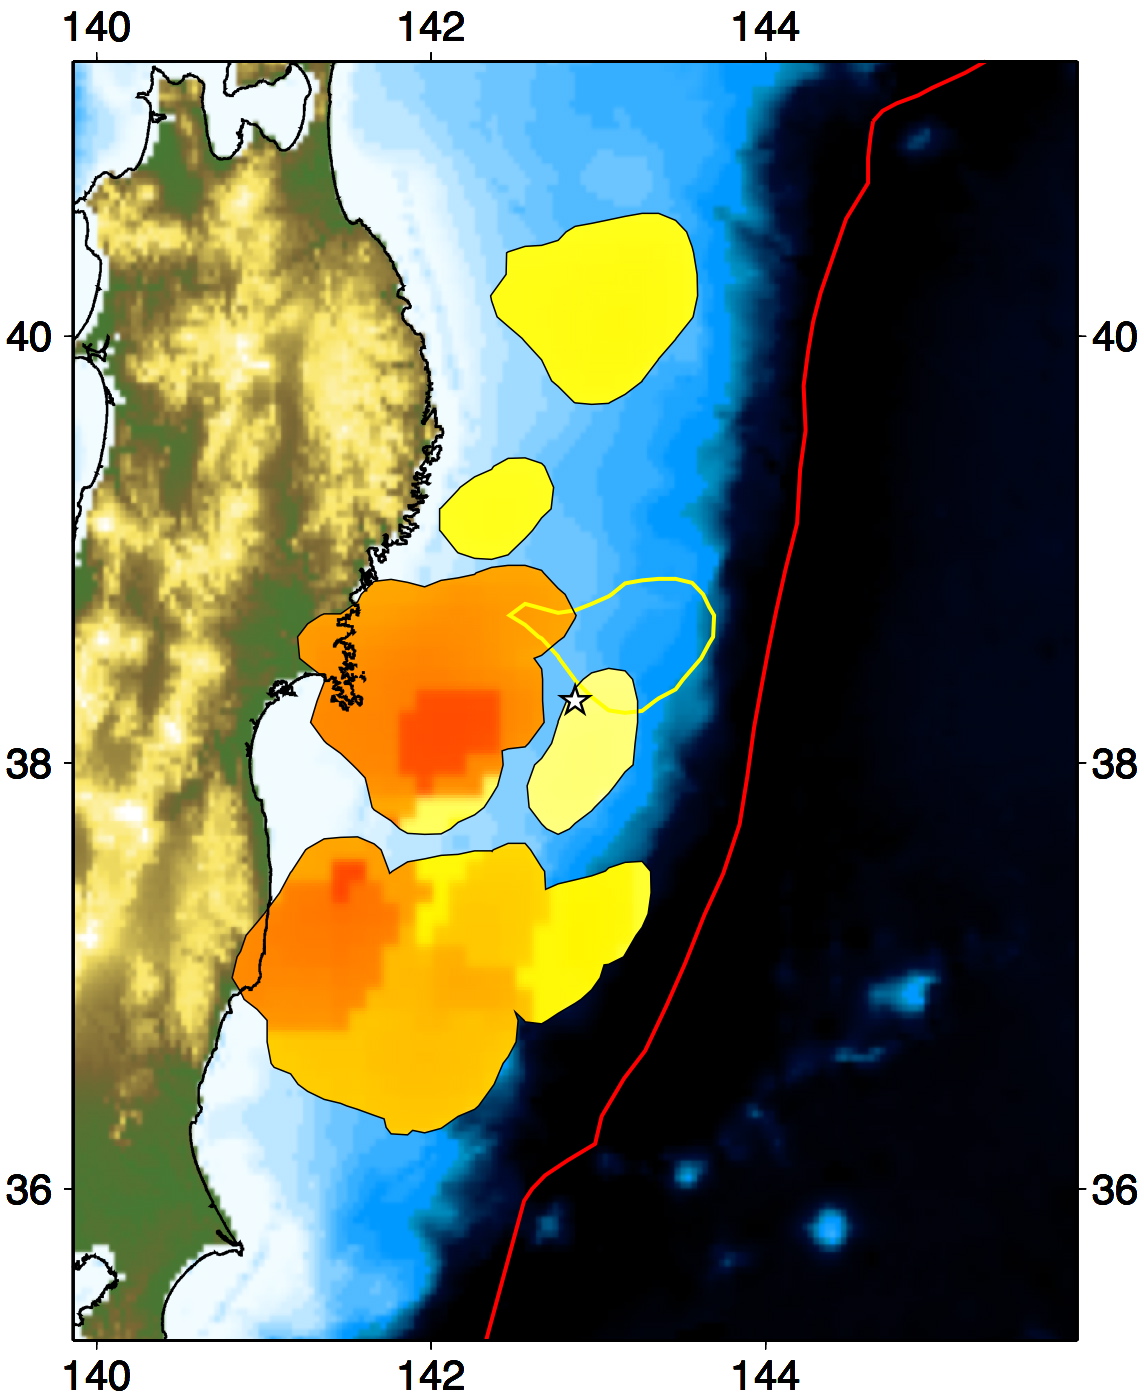
The figure on the left shows the relative amount of energy release from various locations that radiated energy during the first 25 minutes (darker orange showing higher energy release). The largest energy release occurs downdip of the epicentre, and the regions south of the epicentre release more energy than segments to the north (partially due to multiple large aftershocks on Mw 9.0 earthquake). The amount of energy release from different segments vary considerably (right), and the colours are not simple relative amplitude, but logarithm of the relative amplitude. Consequently, the saturation levels of the colour scale for the animation above is time dependent to bring out different episodes.
Even though the segments are not continuous, the total extent of the collection of events is about 480 km, and the width is about 170 km.
Hidden Earthquakes
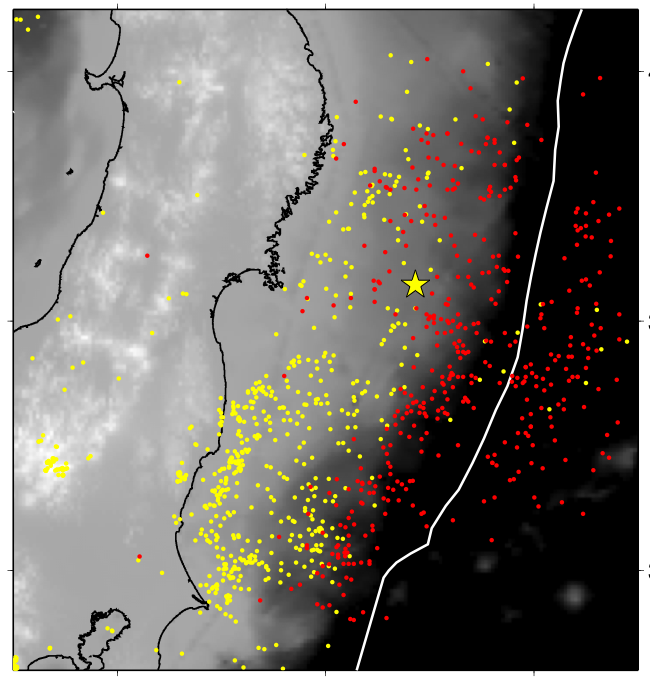 |
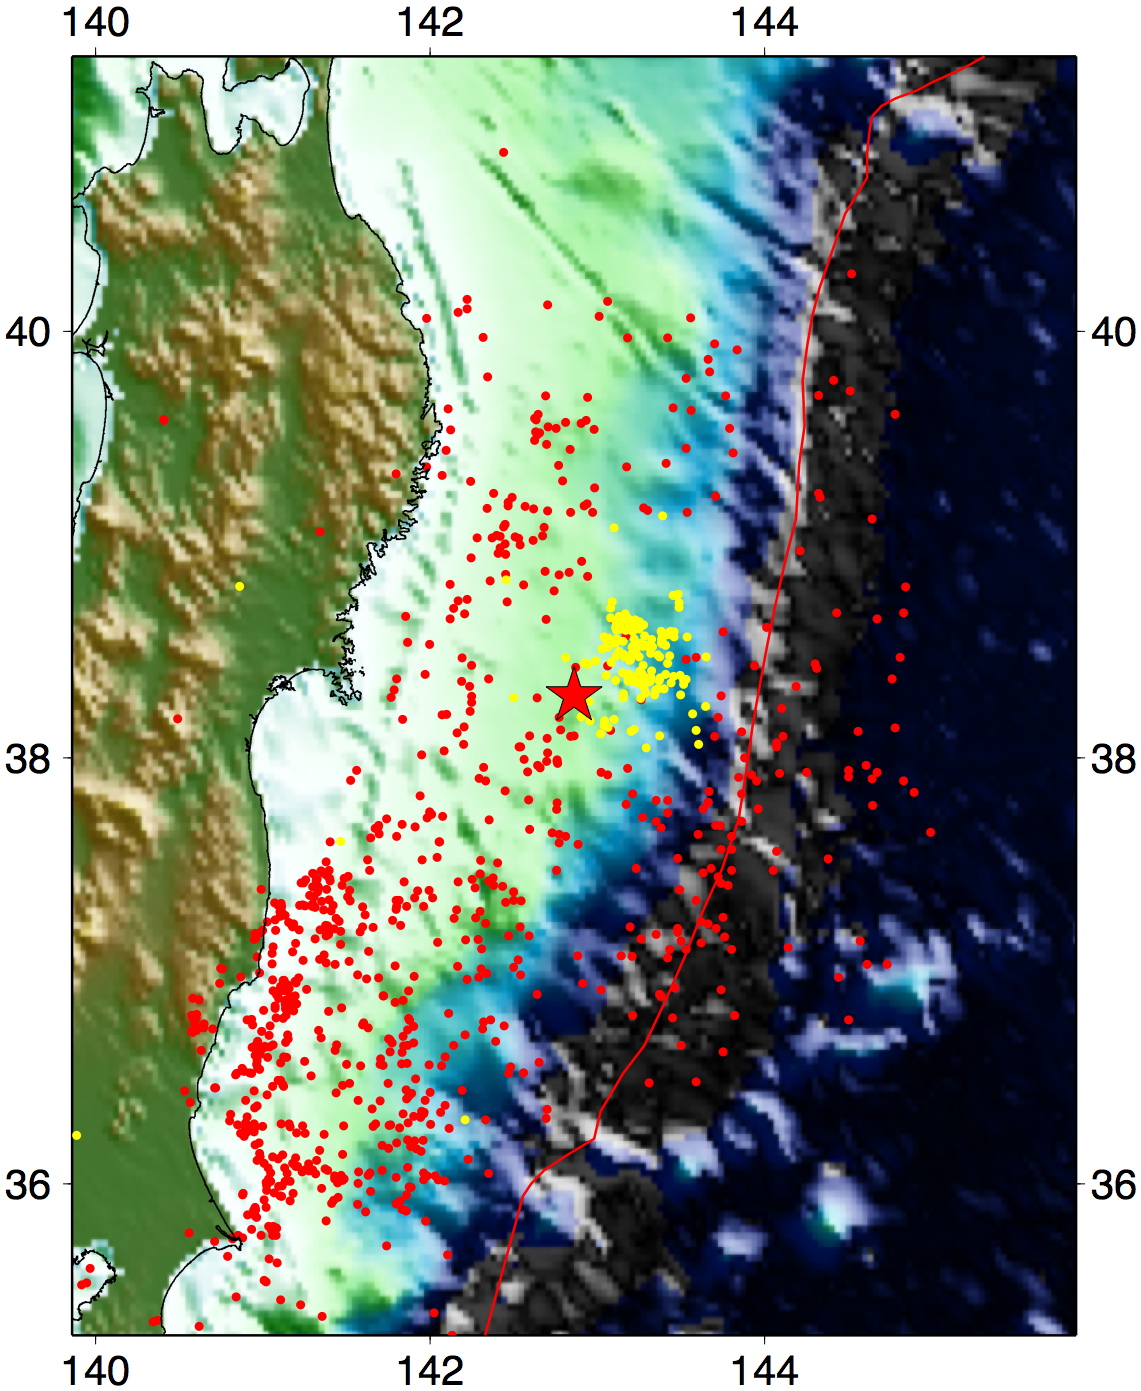
Application of the back-projection method to times immediately after the 2011 Japan earthquake shows that earthquakes as small as magnitude 4's can be detected using seismic networks in North America (with main contribution from the USArray Transportable Array). Some of these earthquakes are not listed in the JMA (Japan Meteorological Agency) or NEIC (National Earthquake Information Center) catalogues.
|
Comparison with Historical Earthquakes
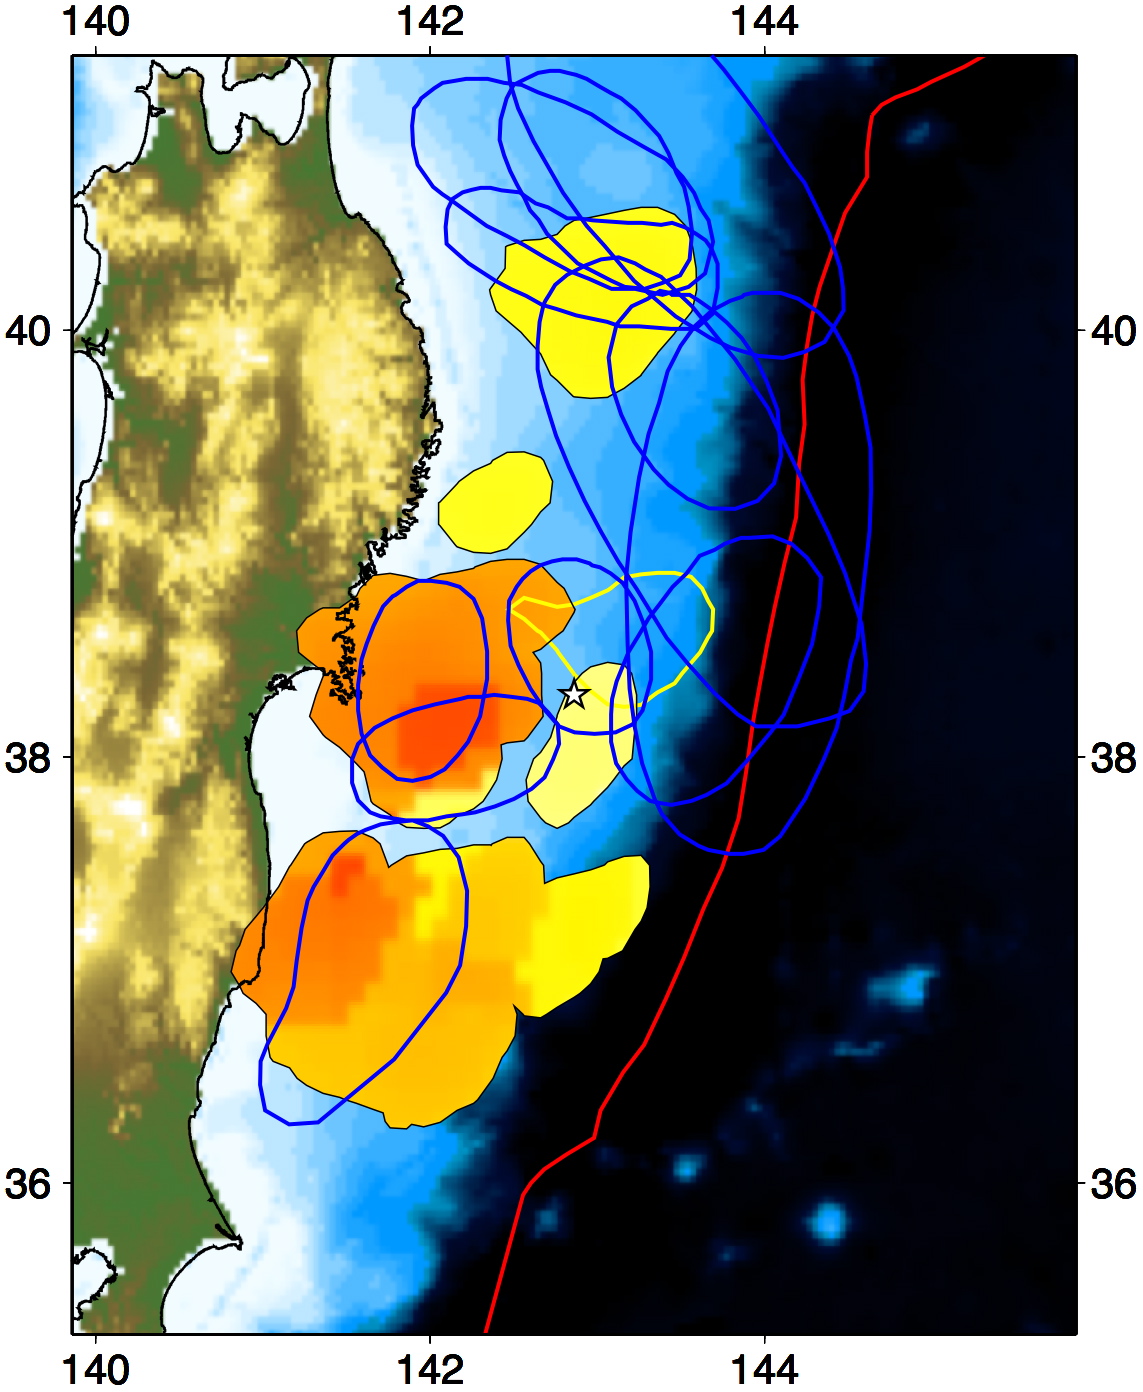 |
The largest energy release occurred on segments that are known to have generated tsunamis in the past (blue contours). The patch of the Mw 9.0 earthquake close the epicentre overlaps with the source regions of the 1915, 1936, and 1978 tsunamis. The downdip part of the southern potion also has high energy release, and this region corresponds to the 1938 tsunami source area. The rupture area of the March 9 earthquake matches well with the source region of the 1915 earthquake. The northernmost region that slipped at the end of the super mainshock has slipped multiple times in the recorded history, i.e., 1994, 1968, 1960, 1931, 1901, and so on, suggesting that this patch has short recurrence time compared to other parts of the plate interface. |
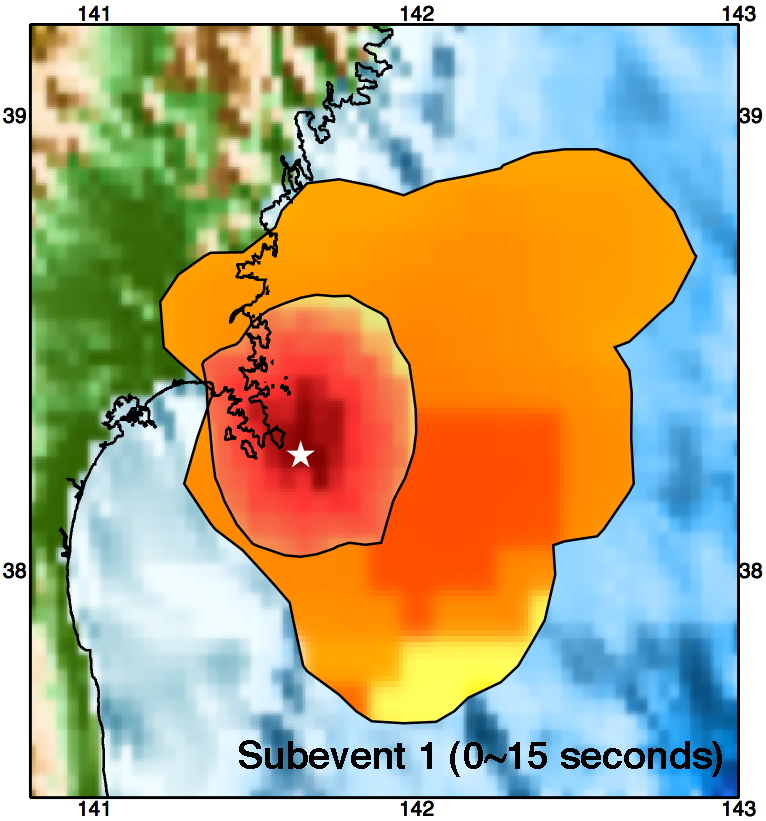
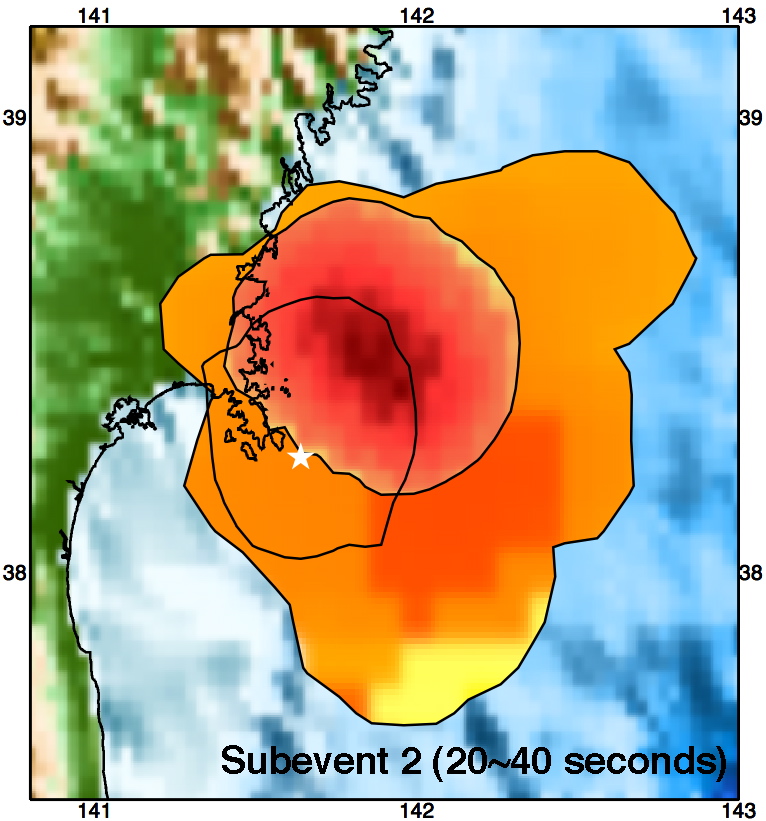
April 07, 2011 Mw 7.1 Aftershock
| Subevent 1 | Subevent 2 |
 |
 |
 |
This aftershock, which caused strongest ground shaking in the Tohoku area after the Mw 9.0 event on March 11, occurred within a region which released strong high-frequency energy during the mainshock. The area ruptured in this April 07 event is also an area we identified as an aftershock gap, i.e., the interface does not seem to have re-ruptured in any significant aftershock since the mainshock (based upon continuous back-projection). |
Some Other Earthquakes Investigated Using Back-Projection Method
December 26, 2004 Mw 9.3 Sumatra-Andaman Earthquake
February 27, 2010 Mw 8.8 Maule, Chile Earthquake
Initial Results of March 11, 2011 Earhtquake (March 12, 2011)
References
Kiser, E., & Ishii, M., 2013.
Hidden aftershocks of the 2011 Mw~9.0 Tohoku, Japan earthquake imaged with the backprojection method.
J. Geophys. Res 118, 5564-5576, doi:10.1002/2013JB010158.
Kiser, E., & Ishii, M., 2012.
The March 11, 2011 Tohoku-oki earthquake and cascading failure of the plate interface.
Geophys. Res. Lett. 39, L00G25, doi:10.1029/2012GL051170.
Kiser, E., & Ishii, M., 2011.
Back-projection results for the Mw 9.0 March 11, 2011 Tohoku, Japan earthquake.
IRIS Annual Report, 10-11
Ishii, M., 2011.
High-frequency rupture properties of the Mw~9.0 Off-the-Pacific-Coast-of-Tohoku earthquake.
Earth, Planets, Space 63, 609-614.
Kennett, B.L.N, Gorbatov, A., & Kiser, E., 2011.
Structural controls on the Mw 9.0 2011 Offshore-Tohoku earthquake.
Earth Planet. Sci. Lett. 310, 462-467.
Acknowledgment
The USArray Transportable Array data were obtained from the Incorporated Research Institutions for Seismology Data Management Center.