Seismic Structure of Upper-Mantle Discontinuities Based on High-Frequency Triplication Data
Constraining seismic properties of the 410- and 660-km discontinuities which delineate the mantle transition zone, is crucial in understanding the mantle composition and convection dynamics. One approach to study the transition zone is to use "triplicated" arrivals of seismic data. When a wavefield encounters an abrupt increase in wave speed with depth, three different phases, direct, reflected, and transmitted phases, result, and they can arrive at the same distance. In the traveltime curve, the three arrivals appear to make a bowtie shape (Figure 1 Top Left), hence the name triplication. Triplication pattern and its location, i.e., travel times of three types of waves, provide constraints on the depth and velocity jump at the discontinuity.
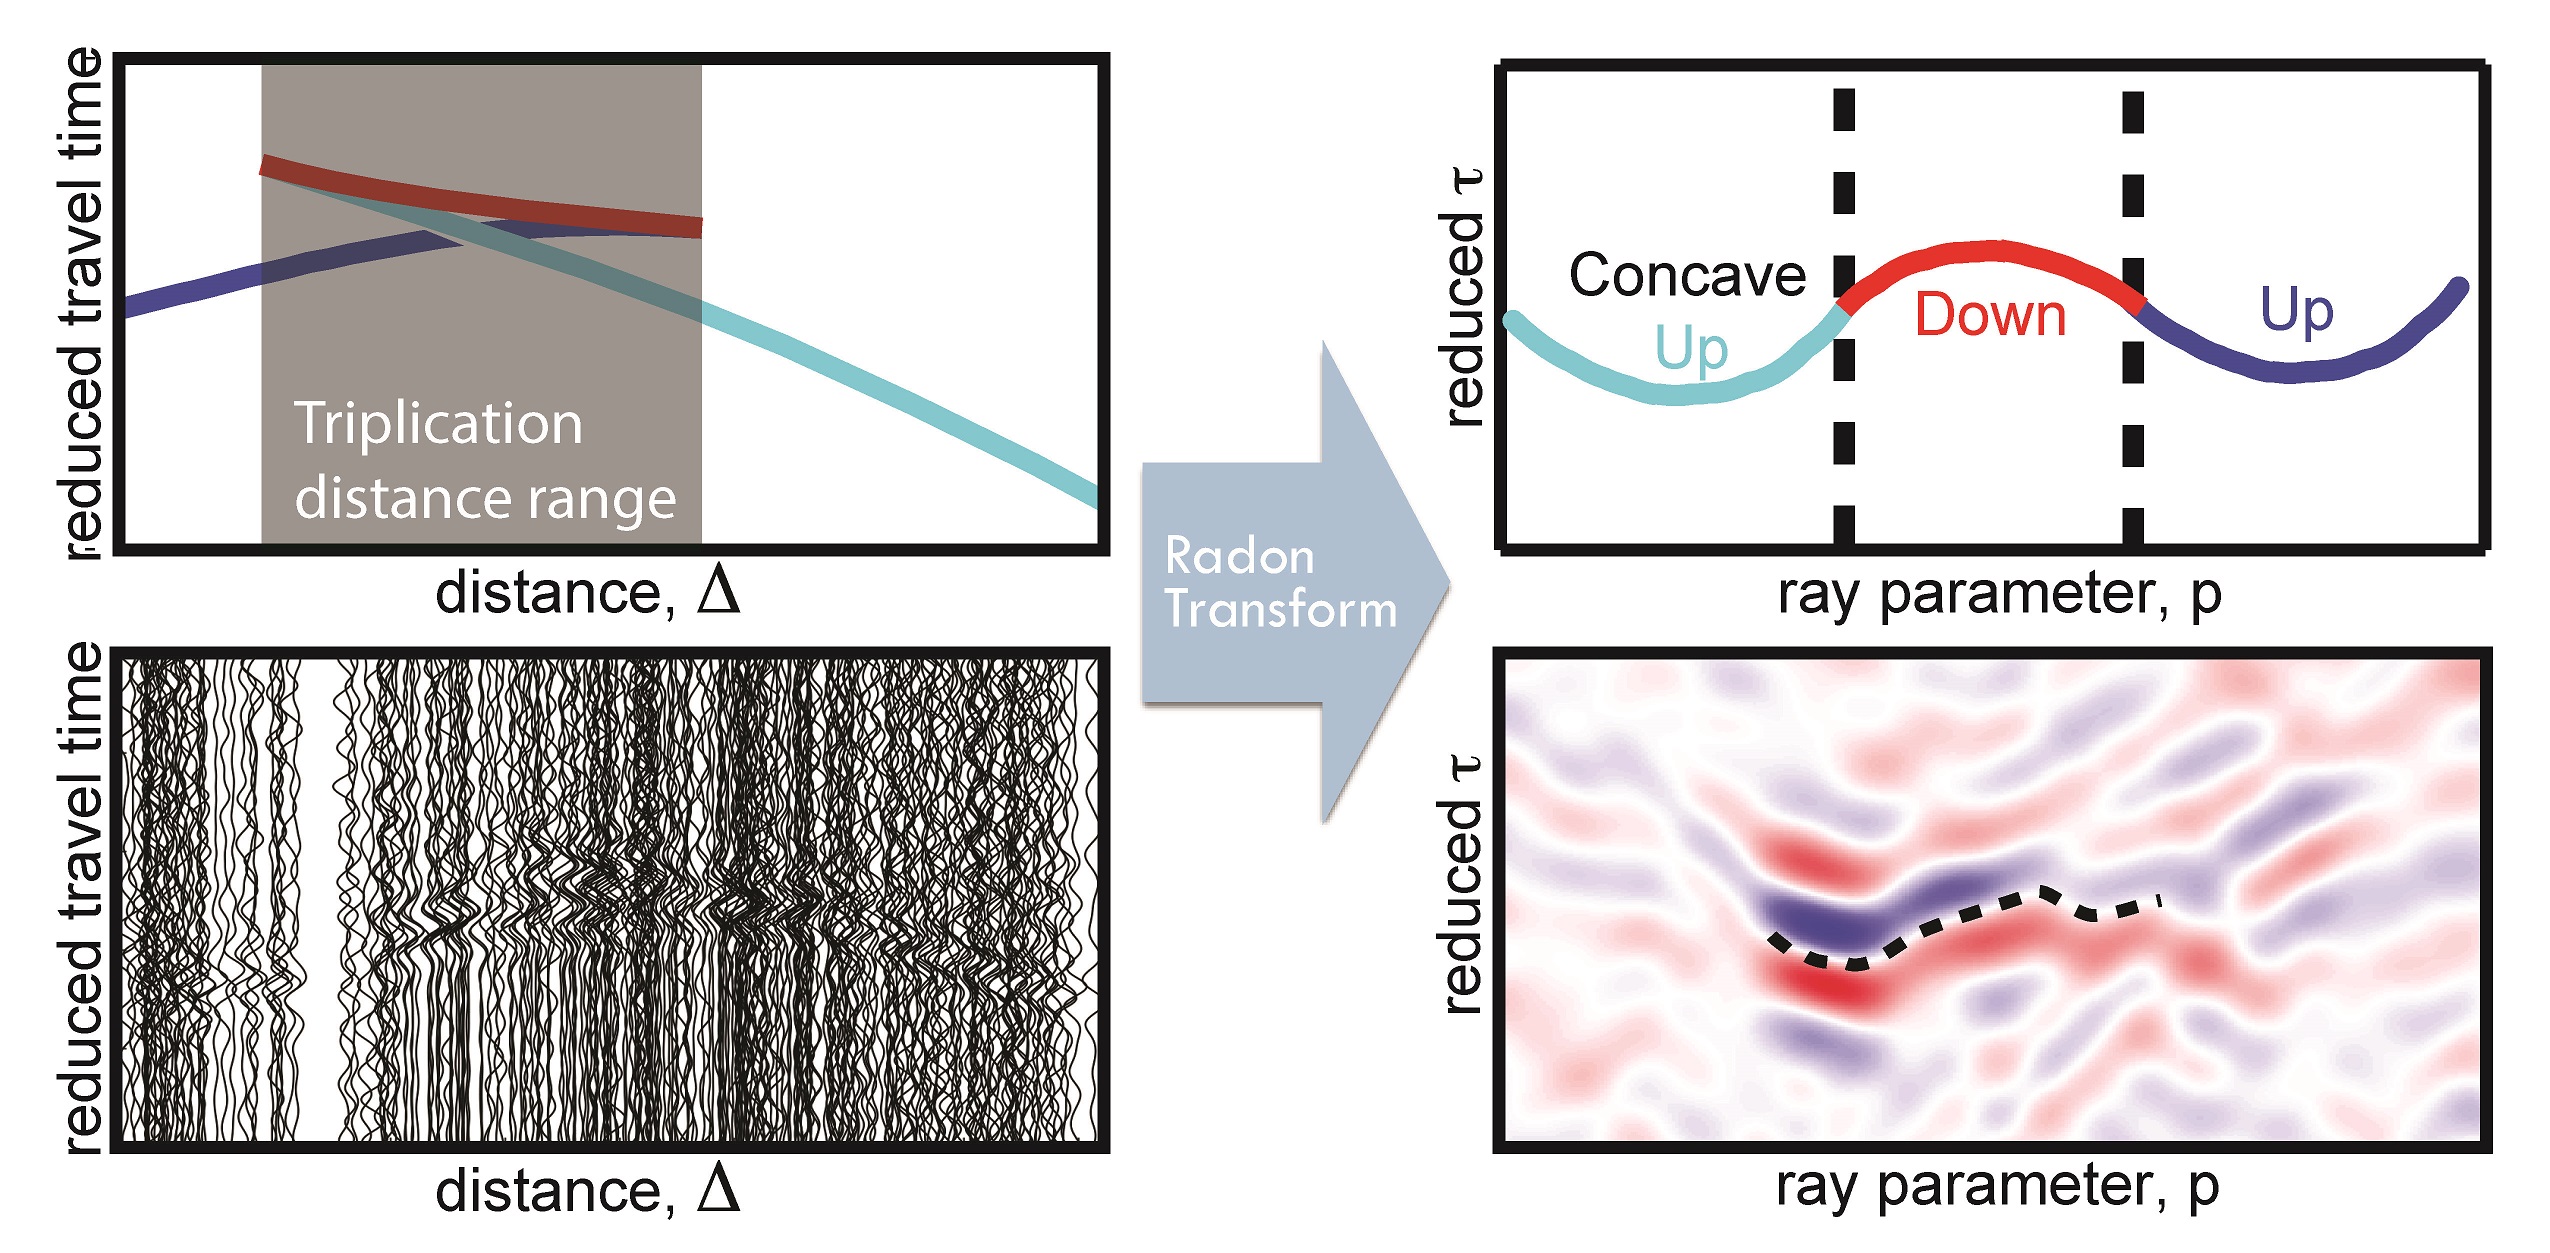 |
Figure 1: Predicted and observed data in T-D domain and τ-p domain. (Top) The bowtie shaped travel time curve becomes unwrapped as an “ω” shaped τ-p curve after Radon transform. Each phase is separated from one another with different signs of curvature: (+) for prograde and (-) for retrograde. (Bottom) Radon transform of noisy data shows clear τ-p curve, and brings out the information from the data.
One of the challenging components in using triplication data, however, is to identify the three individual phases, since they arrive close in time and overlap with each other (Figure 1 Botton Left). In order to separate the three phases, we apply Radon transform to short-period seismograms recorded by a dense array of stations. This approach unwraps the triplication pattern, and brings out the high-frequency information that is not easily accessible in the original form of data (Figure 1 Right). Subsequent modeling of the unwrapped data allows velocity jump, depth, and width of the discontinuities to be obtained (Figure 2).
|
|
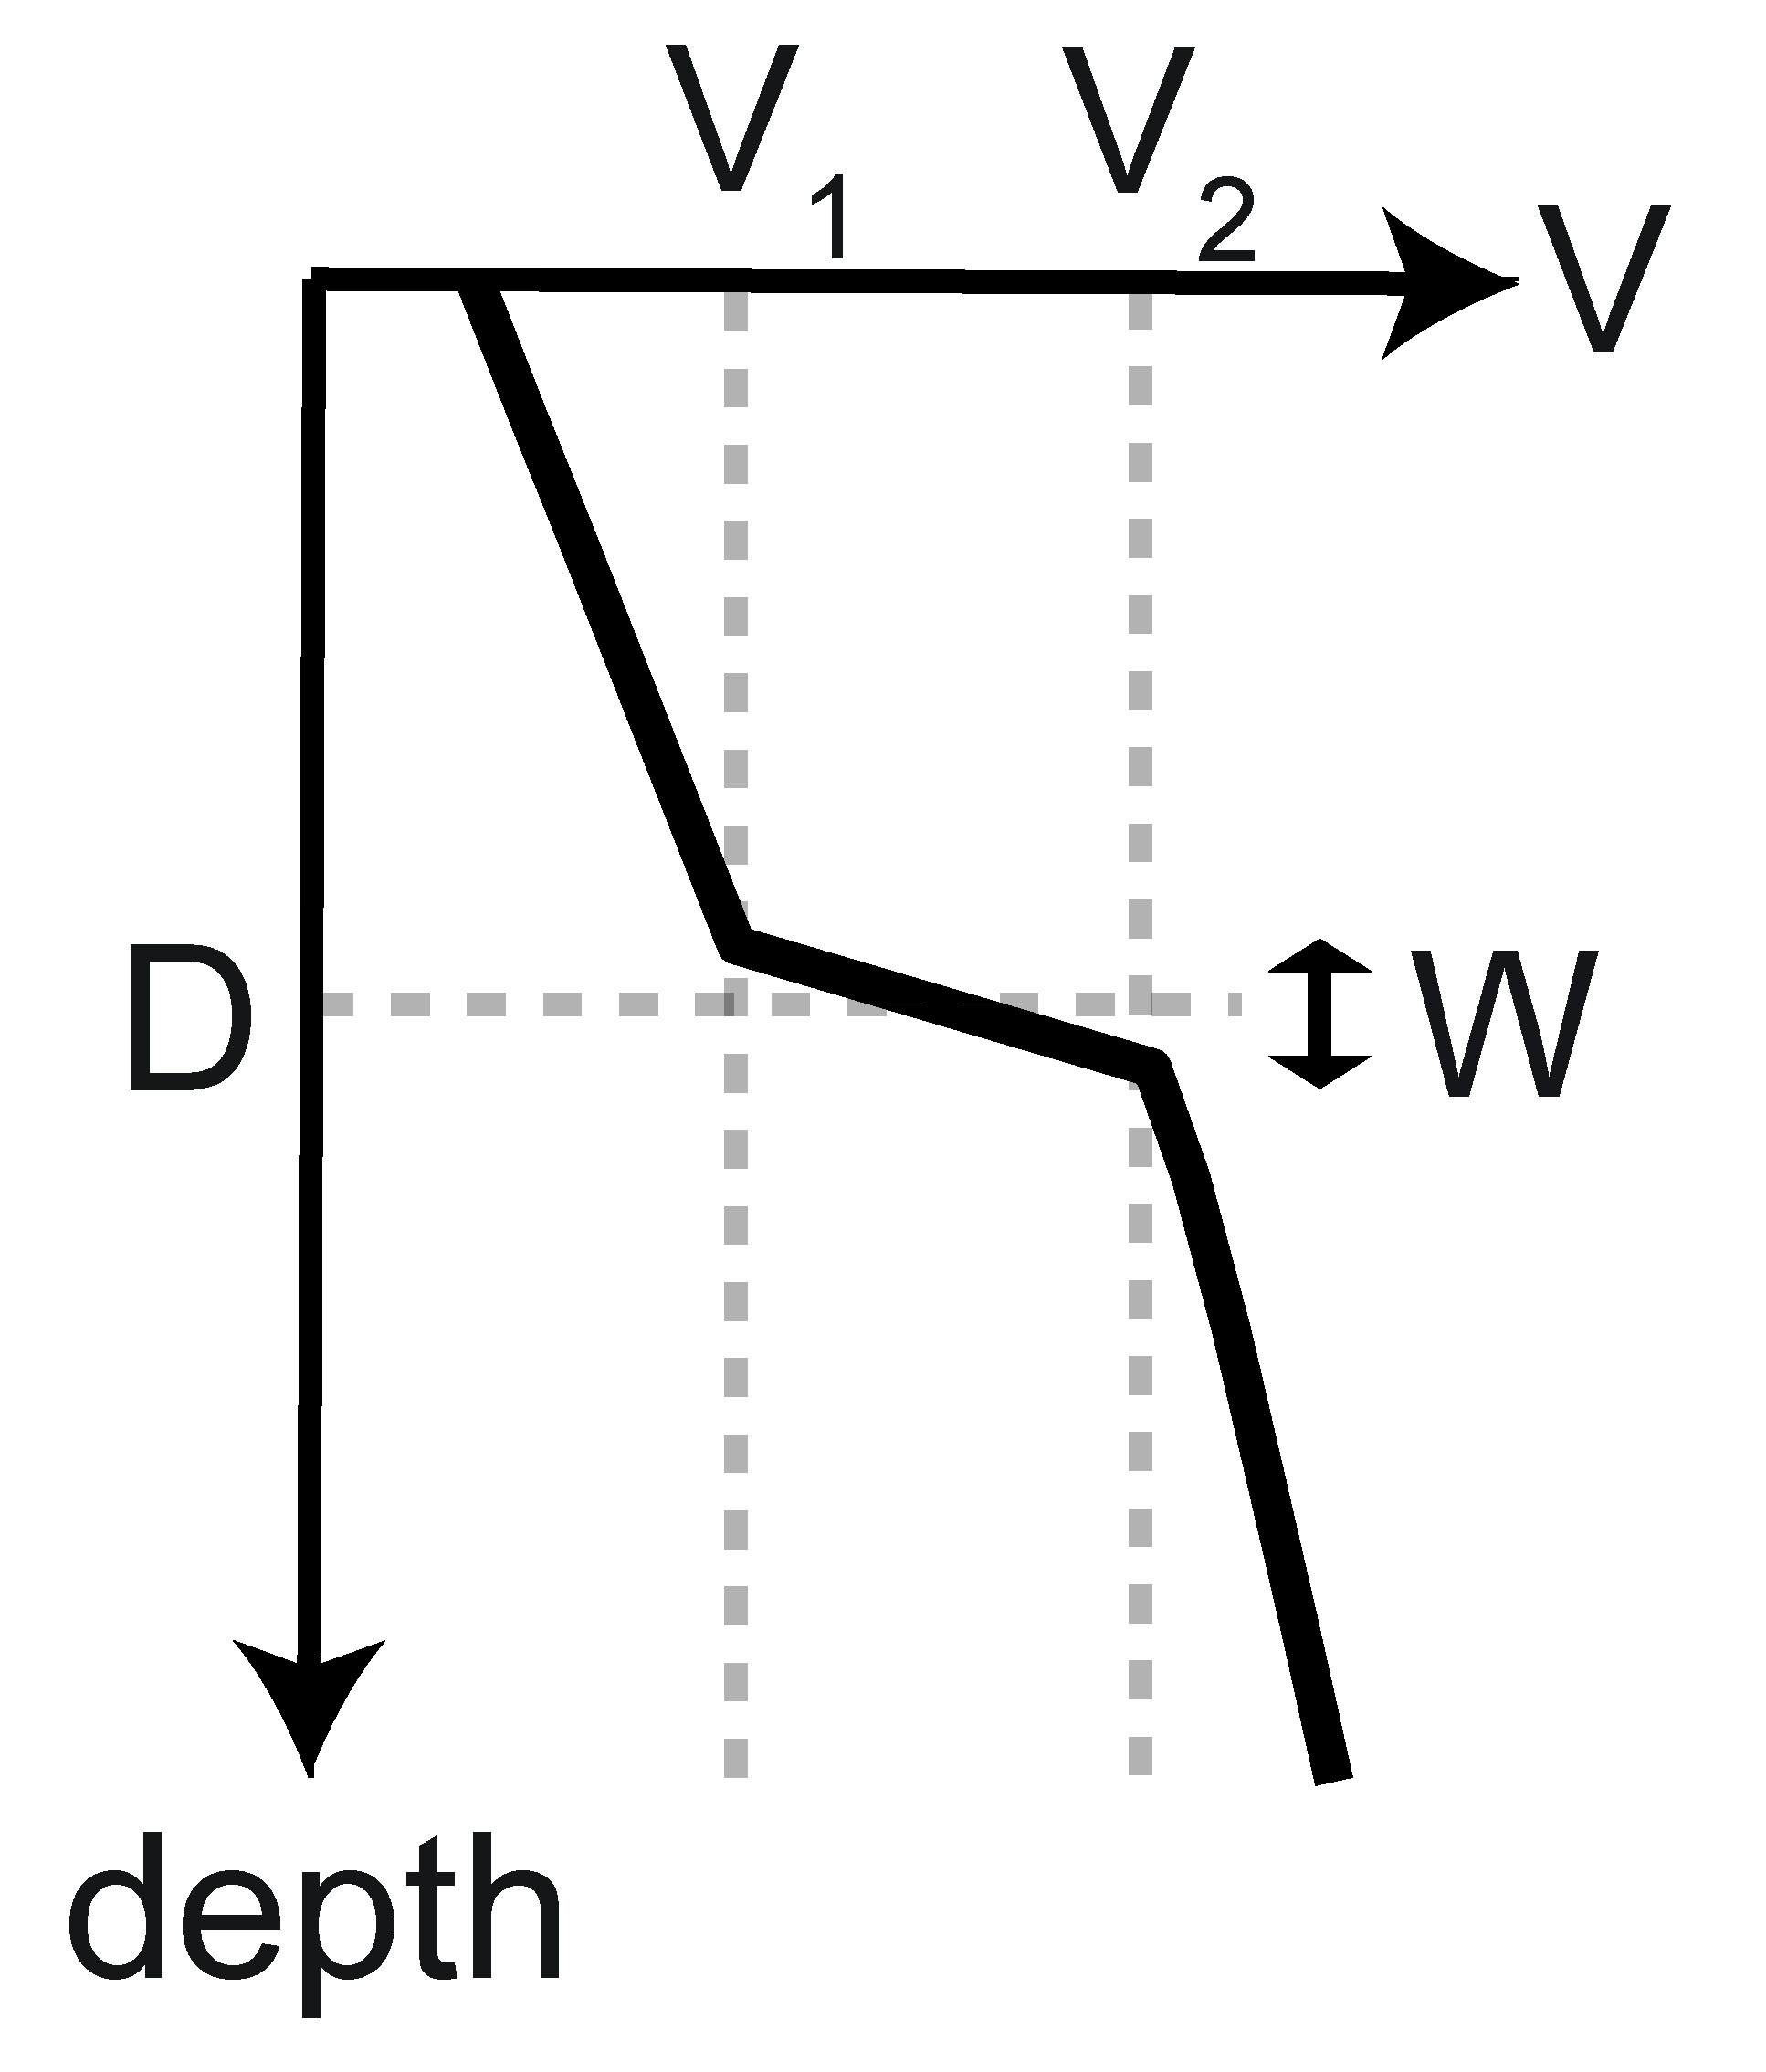
Figure 2: Investigated parameters. Velocities at the top (V1) and bottom (V2), depth (D), and width (W) of the discontinuity |