Characterization of Oceanic Storm Systems via Ambient Seismic Noise
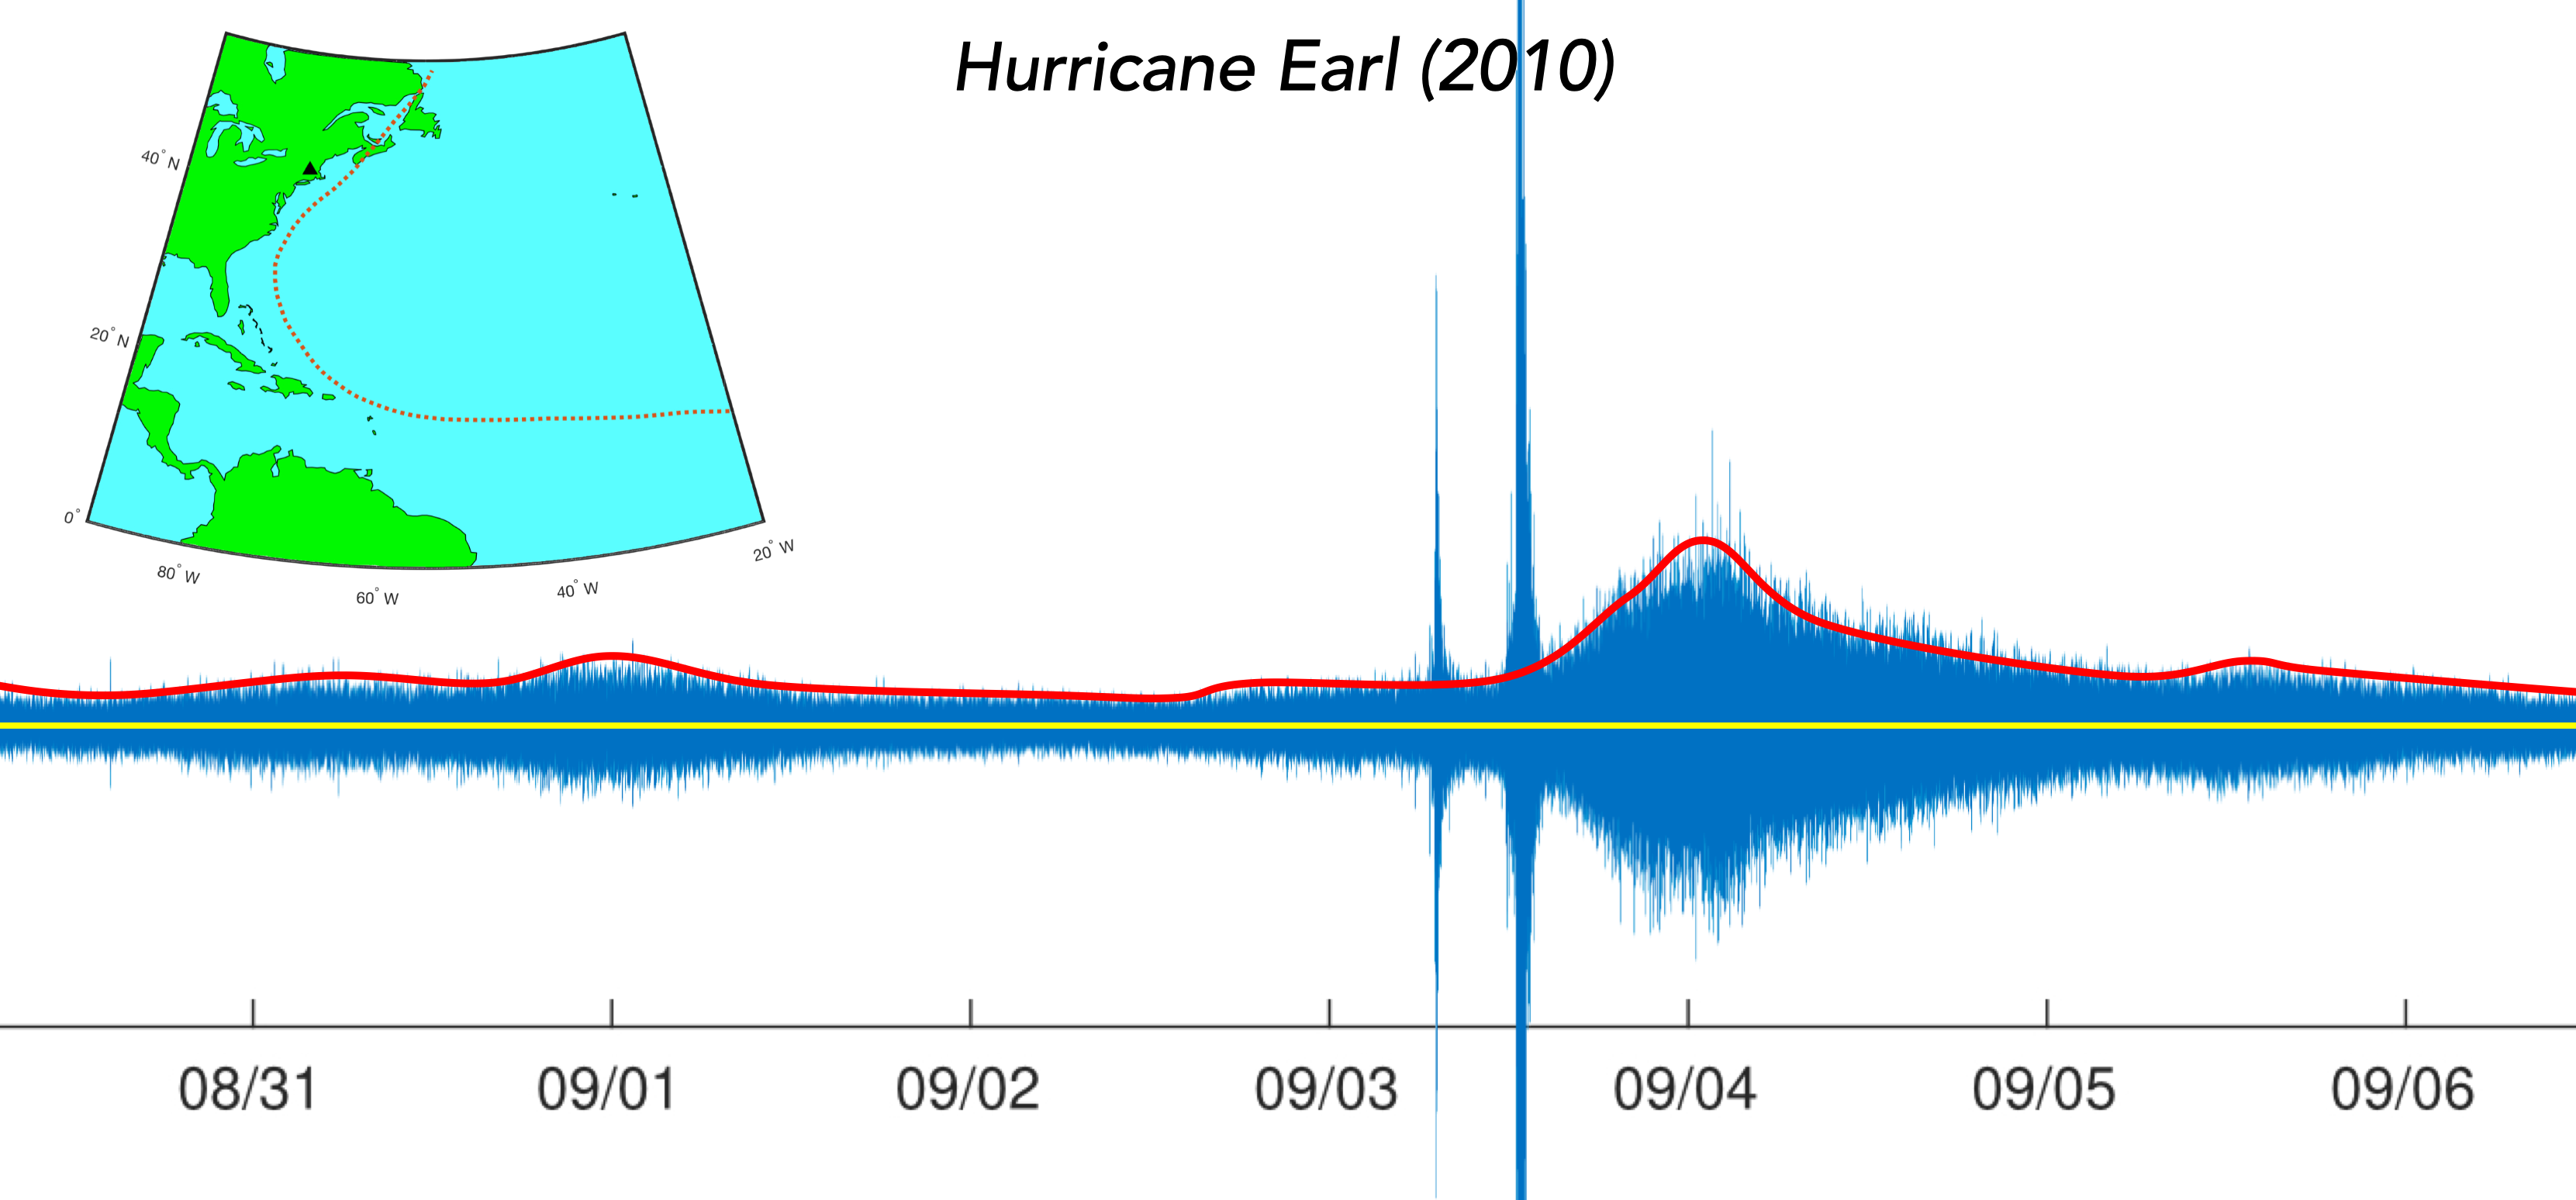
Ocean generated ground-motion, or oceanic microseism, is a feature found on seismograms recorded on land-based seismometers. Identified nearly a century ago, continued improvements in recording and analysis techniques afford opportunities for novel exploration of this phenomena and its charactreristics. Tropical cyclones generate increases in the observed oceanic microseism on land that register as storm systems pass nearby (Figure 1). This project involves analysing oceanic microseism observations during tropical cyclones taking place in the Atlantic between 2012 and 2015, when a regularly-spaced recording network was present across the eastern United States (Eastern Transportable Array or TA). The analyses will help to understand how different storm characteristics such as intensity, location, and direction of movement manifest as different oceanic microseism signals. The eventual goal of the project is not only to recognize when a cyclone is taking place, but also to have the ability to articulate specific parameters of interest (e.g., intensity) from the seismic data alone. When it is noted that archives of analog seismic data stretch back to the turn of the 20th century, the desirability of being able to extract such information becomes immediately apparent. Programs like DigitSeis that convert scanned images of analog seismograms to digital time series allow the application of modern signal processing to these legacy archives. Such processing provides the opportunity to improve inventories of tropical cyclones from the pre-satellite era when completeness of storm records often depended on the volume and location of shipping traffic. These efforts mark the first steps towards a more ambitious use of legacy seismic data as a novel data source to help better understand changes to tropical cyclone behavior over the last century. Such improvements would have applicability to problems including the changing climate and developing future forecasts.
extracting high quality digital data