|
A Novel Cross-Correlation-Based Automatic Phase-Picking Algorithm for Seismic Array Data and its Application to PcP Arrivals 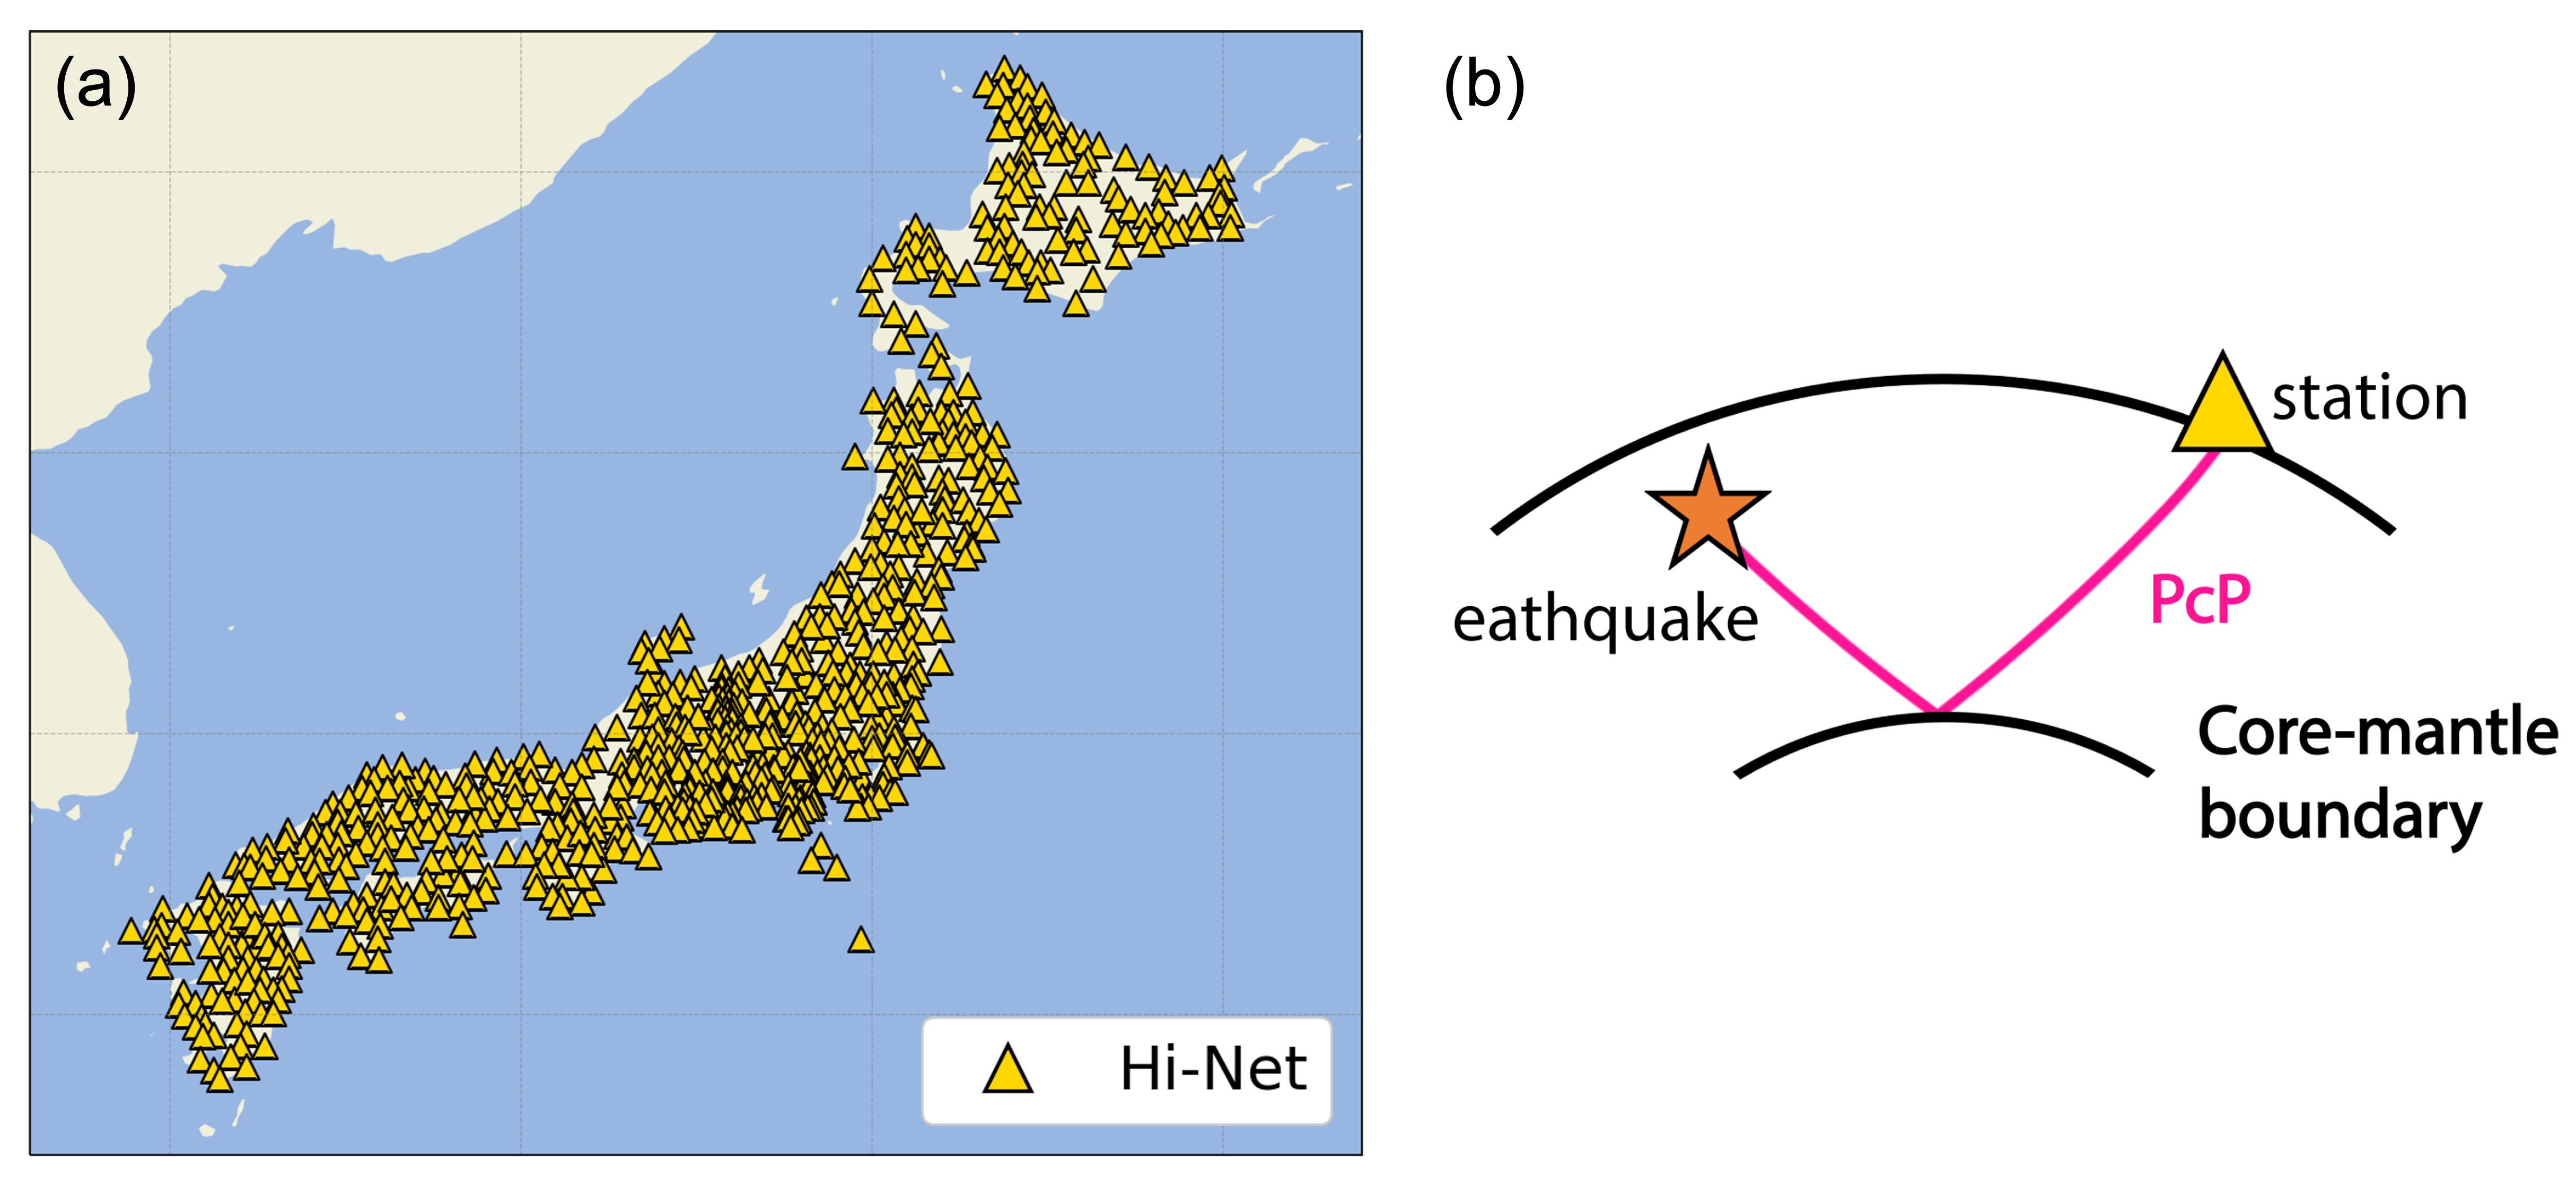
Figure 1: Stations and seismic phase used in this study. (a) A map of the Hi-Net array (yellow triangles) in Japan, which consists of about 800 short-period borehole seismic stations. (b) Ray path (magenta) of a core-reflected PcP wave. The orange star represents the earthquake, and the yellow triangle represents the seismic station. One way to study the Earth's internal structure is to measure the travel times of seismic waves recorded at seismic stations. Seismic arrays, which consist of seismic stations in dense configurations, are particularly useful to resolve fine-scale subsurface structures. These arrays, however, can contain hundreds of stations (Figure 1a), so manual picking of the seismic phase arrival times would be time-consuming and may introduce human bias. Alternatively, an automatic phase-picking algorithm that is potentially more efficient and objective can be used. A conventional automatic array phase picking algorithm is the iterative cross-correlation and stacking, which utilizes the coherency of seismic waveforms recorded at nearby stations to select the arrival times. This method works effectively for cleanly-recorded and well-isolated phase arrivals (Figure 2). 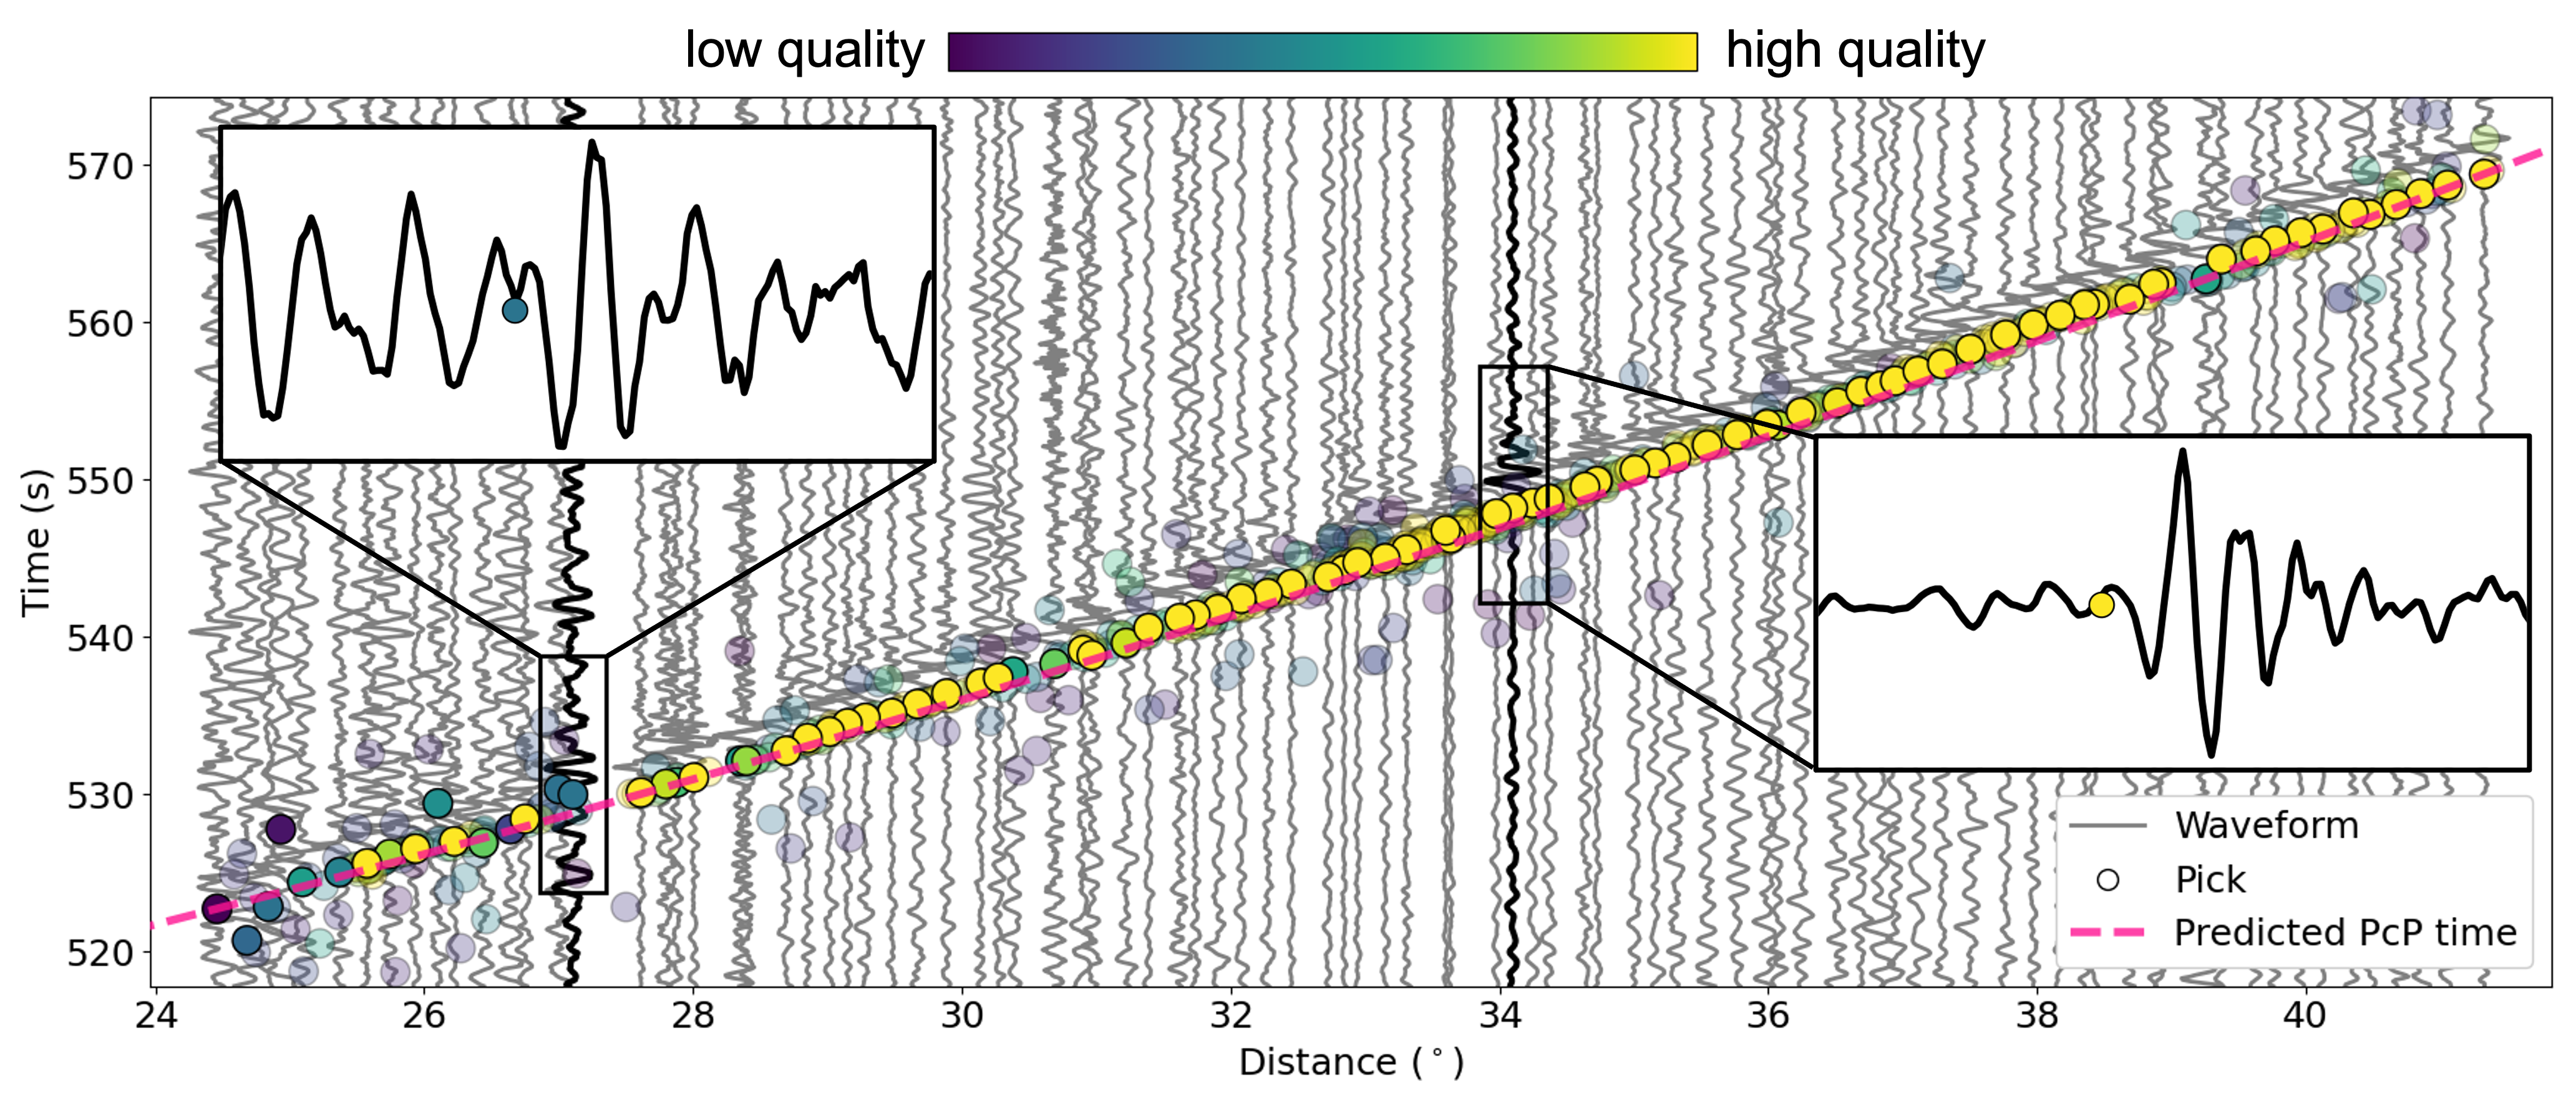
Figure 2: Picking results of a typical cross-correlation algorithm for well-recorded waveforms (grey lines) of PcP arrivals (Figure 1b) at Hi-Net stations. For better visualization purposes, only a selected number of waveforms are shown. X-axis is the angular distance from the earthquake to the station, and y-axis is the time after the hypocentral time. The magenta dashed line shows the predicted PcP travel times, and the circles are the pick times, color-coded by the qualities determined by the algorithm. The color scheme is shown at the top. Yellow indicates high quality, and dark blue indicates low quality. Solid circles are the pick times for the selected waveforms, and transparent circles are the pick times for all Hi-Net stations. The bottom right inset shows an example of a high-quality pick, and the top left inset shows an example of a low-quality pick. However, different seismic phases can arrive at a station at similar times, which becomes a problem if the target phase of interest has similar or even smaller amplitudes compared to its neighboring phases. In this case, a conventional cross-correlation method picks up a mixture of different phase arrivals (Figure 3a). 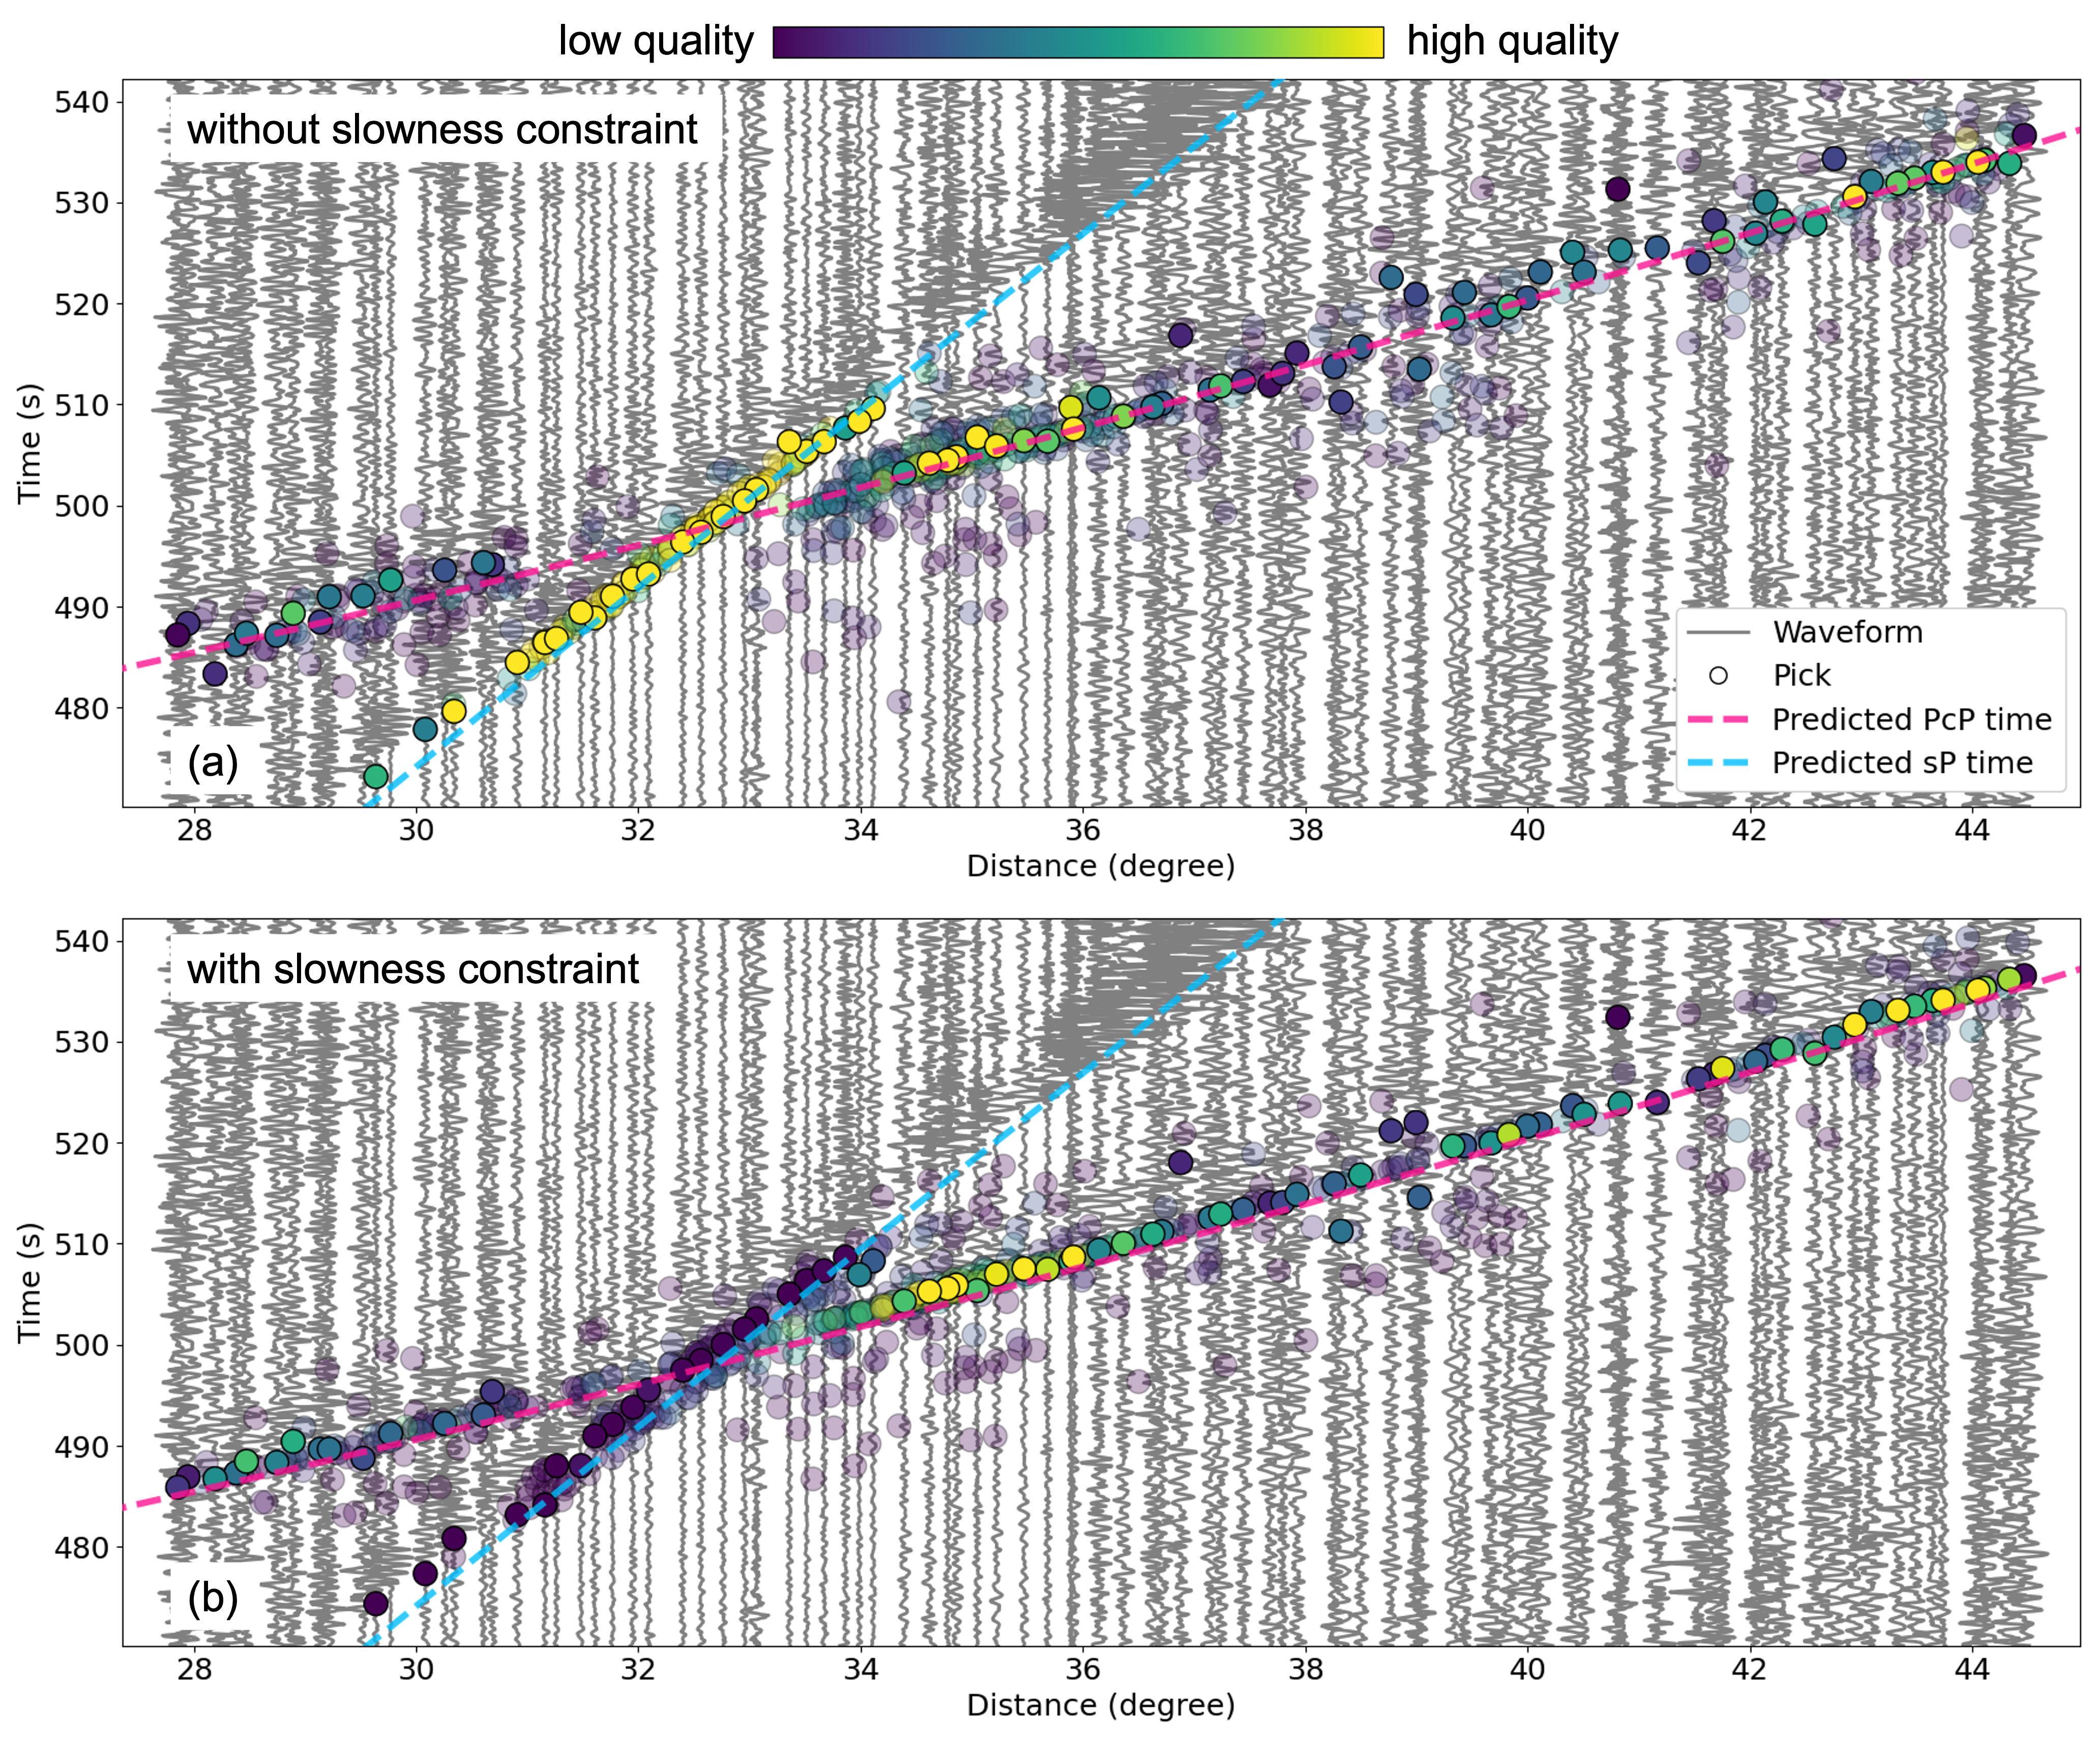
Figure 3: Same as in Figure 2 but for more complicated waveforms. The magenta dashed line shows the predicted travel times of the target phase, PcP, and the cyan dashed line shows the predicted travel times of a neighboring phase, sP. (a) Without the slowness constraint. (b) With the slowness constraint. One method to unravel picks of different phases is to utilize the slowness of each phase. More specifically, picks of a particular phase define a trend, which is detected by counting the number of picks associated with different slownesses and times (Figure 4). Weighting schemes is then applied to down weigh the picks that are farther away from the target trend or closer to the neighboring trend. This process, slowness constraint, is embedded into the iterative cross-correlation algorithm, which results in less scattering of the PcP picks, and lower qualities of the crossover picks (Figure 3b). 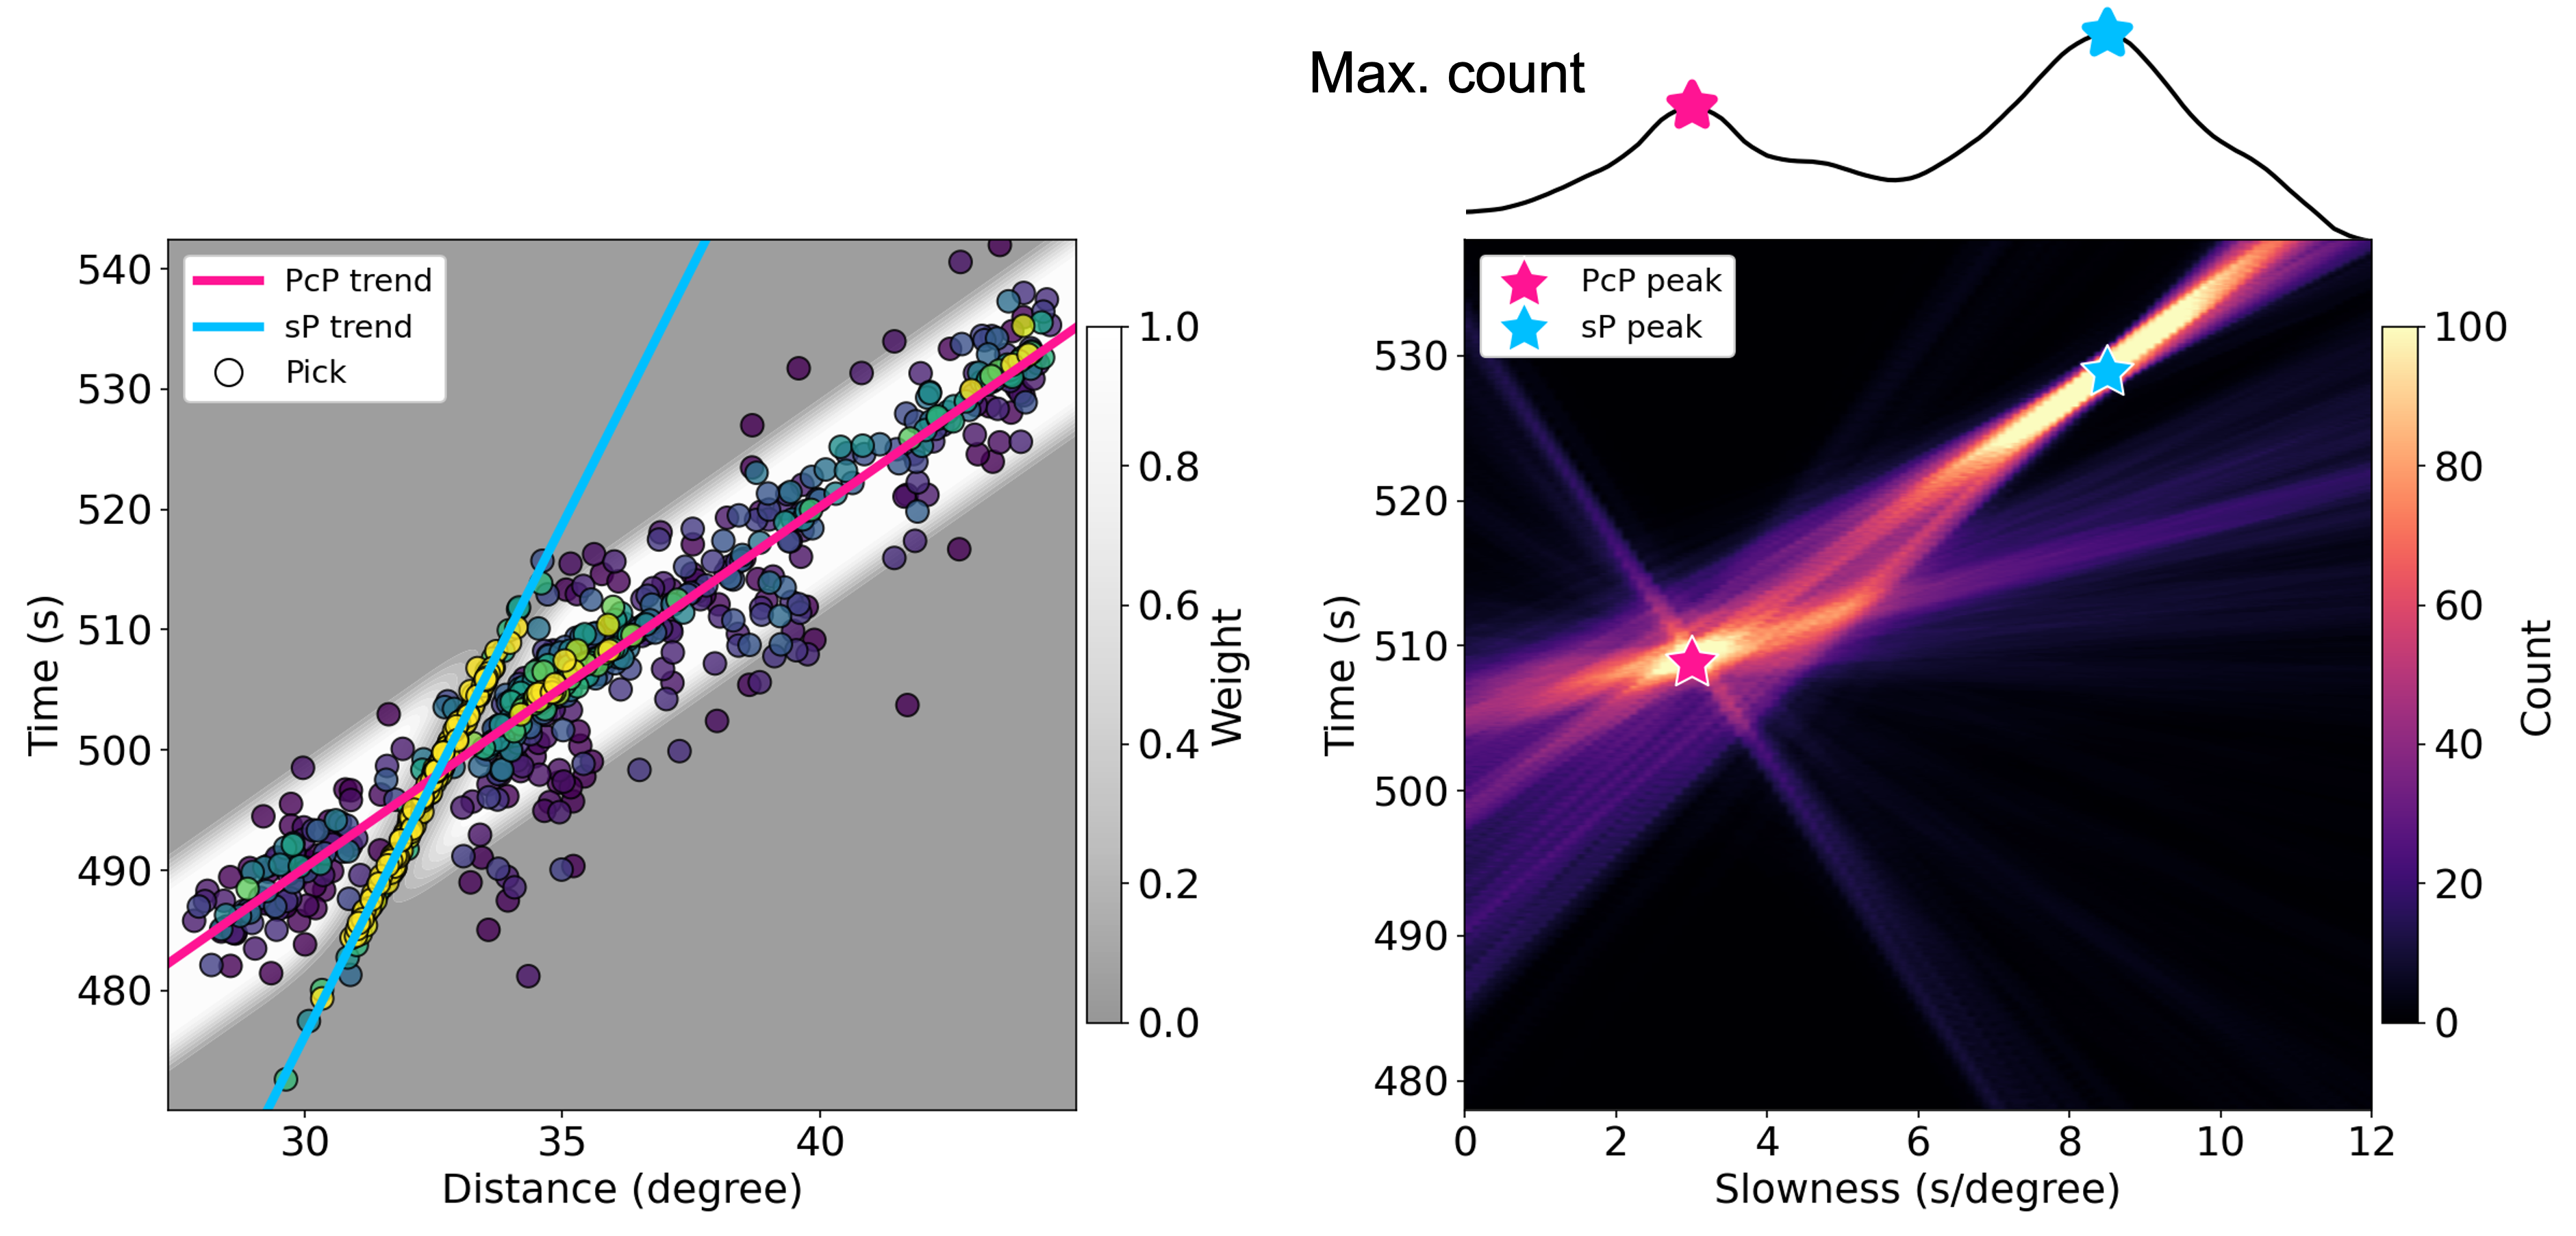
Figure 4: Trend detection using pick count. (a) Pick times (circles) color-coded by the qualities for the recording in Figure 3. The color scheme is the same as in Figure 3. The magenta line is the detected PcP trend, and the cyan line is the detected sP trend. The background colors indicate the weights. The color scheme is shown on the right. White indicates high weights, and grey indicates low weights. (b) Pick counts associated with different slownesses (x-axis) and times (y-axis). Each pixel represents a pair of time and slowness and is color-coded by the value of the count. The color scheme is shown on the right. Light yellow indicates high count and dark purple indicates low count. The black curve at the top shows the maximum count at each slowness. In the black curve, the most prominent peaks associated with the time and slowness pairs (magenta and cyan stars) correspond to the PcP and sP trends in (a). This new algorithm is applied to extract the PcP arrival times from ~240 deep earthquakes with Mw > 5 between 2005 and 2020 recorded at the Hi-Net array. The residual times, the deviations of the extracted arrival times from the predicted arrival times, are calculated and combined using qualities as the weights. These times show laterally coherent features across Japan, such as the negative residual times in the Kyushu region, and the positive residual times across the Shikoku, southern Kansai and Chubu regions (Figure 5). 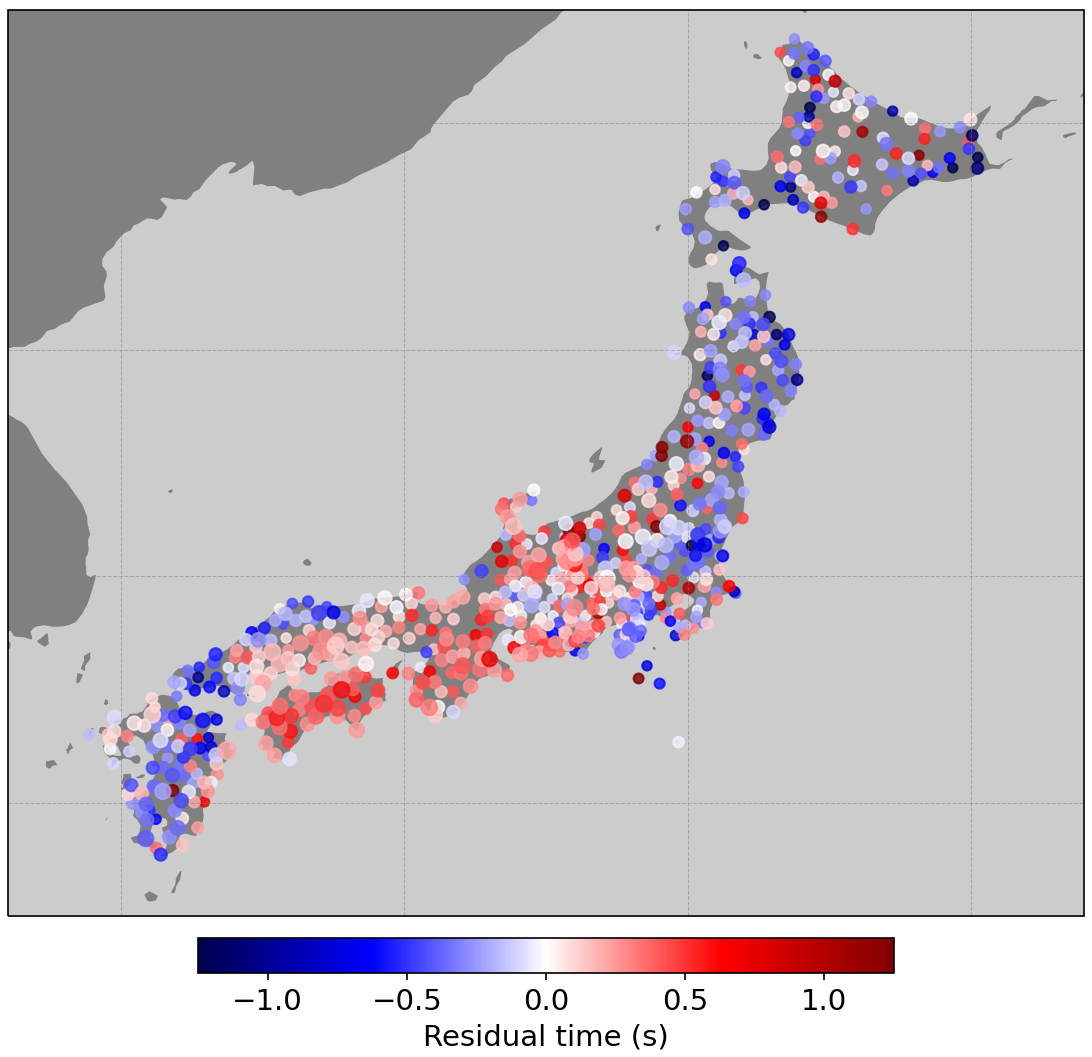
Figure 5: Residual times at Hi-Net stations. Each station is represented by a circle color-coded by the residual time. The color scheme is shown at the bottom. Red indicates positive residual and blue indicates negative residual. |
|
Department of Earth and Planetary Sciences / Harvard University / 20 Oxford Street / Cambridge / MA 02138 / U.S.A. / Telephone: +1 617 495 2350 / Fax: +1 617 496 1907 / Email: reilly@eps.hartvard.edu
|