|
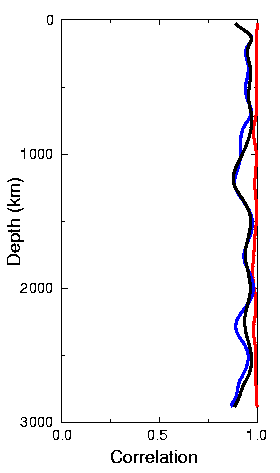
Correlation between density models obtained with different
parameterizations. The red curve is the correlation between the density
models of SPRD6 (S velocity, P velocity, density, and
boundary topography), and SBRD6 (S velocity, bulk sound
velocity, density, and boundary topography), the blue curve is the
correlation between SPRD6 and the density part of MKRD6 (rigidity,
incompressibility, density, and boundary topography), and the black
curve is the correlation between the density parts of SBRD6 and MKRD6.
The resulting density models are all highly correlated.
|


