Supplementary Figure 12
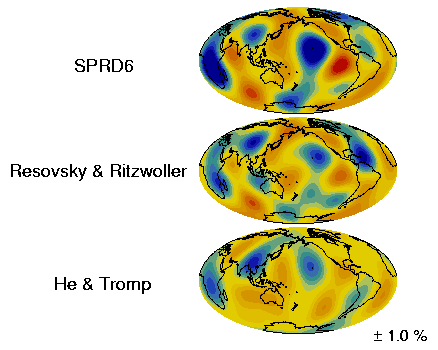
Supplementary Figure 12: Density models at 2850 km depth
Density models at 2850 km depth based upon three different data sets. The map identified as Resovsky & Ritzwoller uses only the modes reported in Resovsky & Ritzwoller (1998) and that identified as He & Tromp uses only the modes from He & Tromp (1996).
Blue regions denote highter than average density and red regions denote lower than average density. The scale of the maps is indicated on the bottom right corner. Coast lines have been superimposed for reference.
References
He, X., and Tromp, J., 1996.
Normal-mode constraints on the structure of the Earth.
J. Geophys. Res. 101, 20053-20082.
Resovsky, J.S., and Ritzwoller, M.H., 1998.
New constraints on deep Earth structure from generalized spectral fitting: Application to free oscillations below 3 mHz.
J. Geophys. Res. 103, 2301-2304.
Miaki Ishii, Department of Earth and Planetary Sciences, Harvard University, copyright ©2000, all rights reserved
Last modified: September 06, 2000

